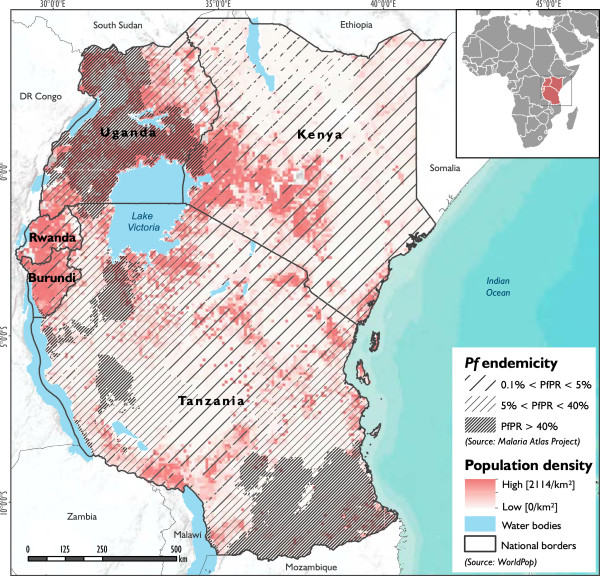
Figure 1.

Location of the study area. The map shows the population density in the study area (in shades of red), overlaid with Plasmodium falciparum (Pf) endemicity levels (Gething et al. [24]) grouped in three different categories (as indicated by the solid lines).
