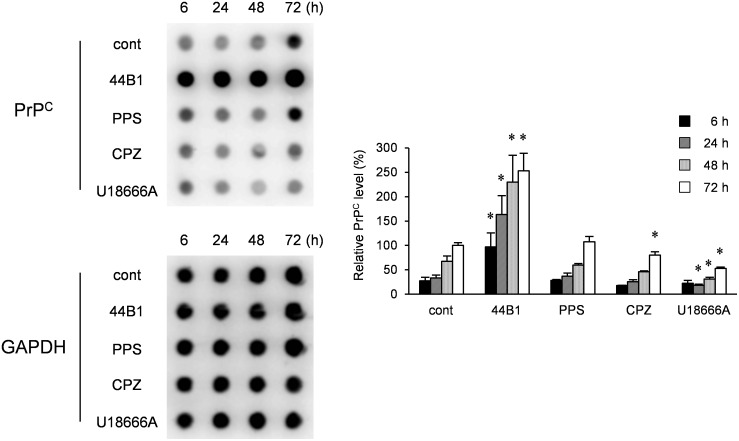
Figure 4. Influence of anti-prion compounds on PrPC levels.
N2a-3 cells were cultured with an anti-prion compound at the EC65 (mAb 44B1, 0.4 µg/ml; PPS, 0.1 µg/ml; CPZ, 10 µM; U18666A, 5 µM) for 6–72 h and subjected to dot-blotting for the detection of PrPC or GAPDH for endogenous control. Representative dot-blot images are shown on the left, and the graph on the right shows the PrPC levels relative to that of 72-h mock-treated cells. The means and SDs of three independent experiments are depicted. Asterisks indicate a significant difference between the cells treated with each anti-prion compound and mock-treated control cells at the same time point (Student’s t-test, p<0.05).

