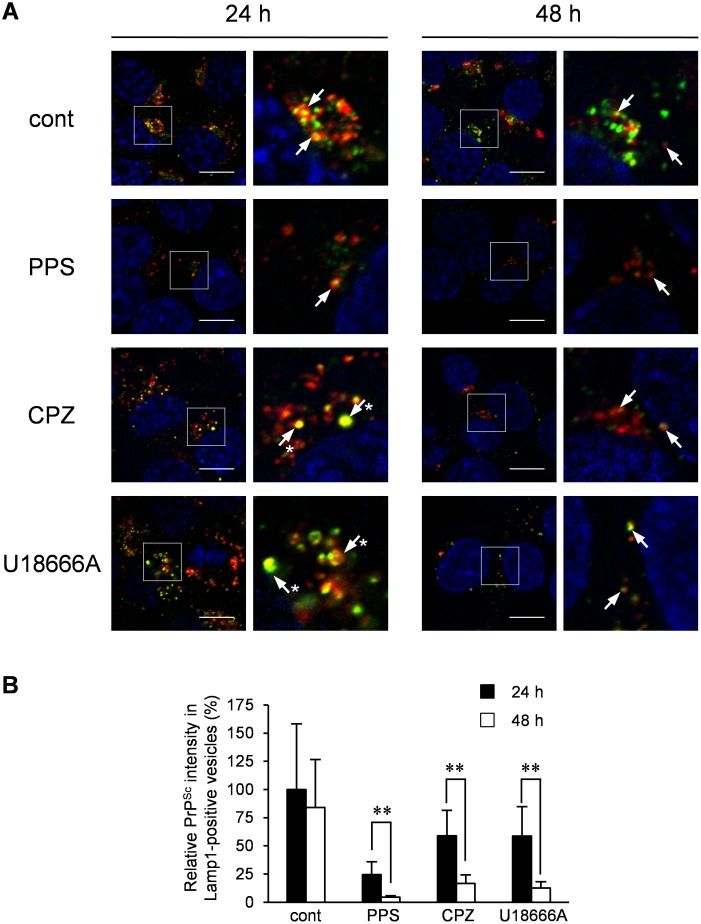
Figure 10. Fate of PrPSc after treatment with CPZ or U18666A.
ScN2a-3-22L cells were cultured with 10 µg/ml PPS, 10 µM CPZ or 5 µM U18666A or without an anti-prion compound for 24 or 48 h. The cells were subjected to the PrPSc-specific indirect immunostaining of PrPSc with mAb 132 and immunostaining for Lamp1 and nuclei. (A) Localization of PrPSc. The left columns show a lower-magnification merged image of PrPSc (green), Lamp1 (red), and nuclei (blue). The high-magnification images of the boxed regions are shown on the right. Arrows indicate representative co-localization of PrPSc with Lamp1. Arrows with asterisks indicate swollen Lamp1-positive vesicles positive for PrPSc. Scale bars: 10 µm. (B) Intensity of PrPSc in Lamp1-positive vesicles. The graph represents the values of the fluorescent intensities of PrPSc in Lamp1-positive vesicles per cell relative to those of PrPSc in Lamp1-positive vesicles per cell in mock-treated cells after 24 h of treatment. The means and SDs of the value acquired in six view fields are shown. Double asterisks indicate a significant difference between cells treated for 24 and 48 h (Student’s t-test, p<0.01).

