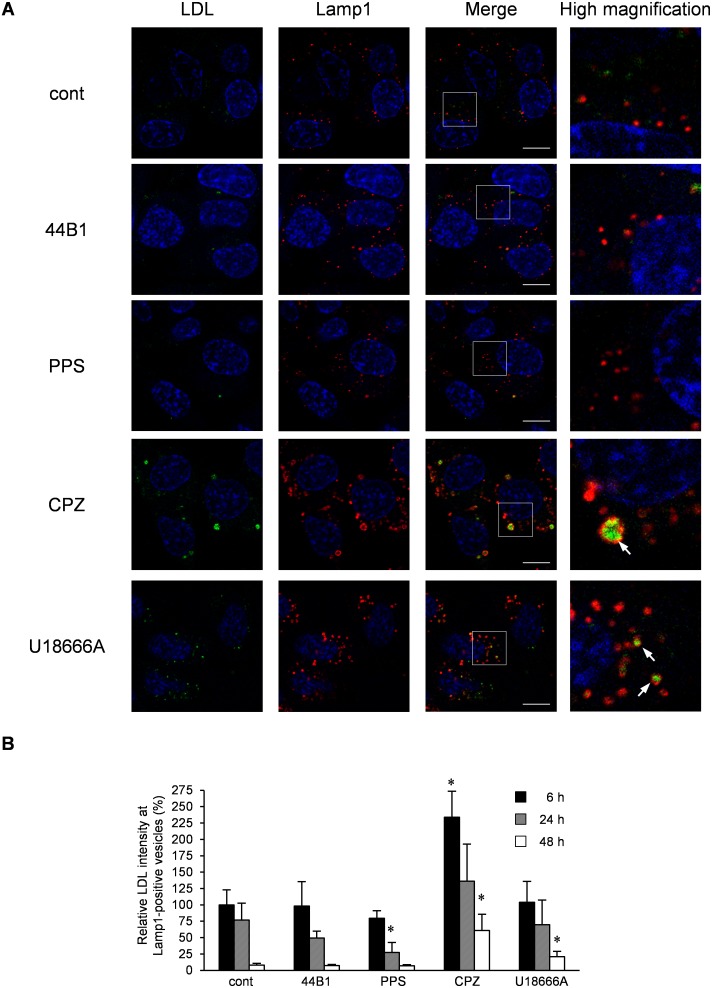
Figure 12. Degradation of LDL in cells treated with anti-prion compounds.
ScN2a-3-22L cells were incubated with Alexa Fluor 488-conjugated LDL (4 µg/ml) for 6 h. After the incubation, the cells were cultured in the presence or absence of 0.4 µg/ml mAb 44B1, 0.1 µg/ml PPS, 10 µg/ml CPZ, or 5 µM U18666A for 6–48 h. The cells were subjected to immunostaining of Lamp1 and staining of the cell nuclei with DAPI. Z-series of the images were acquired at 0.8-µm steps from the top to the bottom of the cells in the area. (A) Localization of LDL. The panel shows the representative images of the signals of LDL (green), Lamp1 (red) and nuclei (blue) in cells treated with the indicated anti-prion compound for 24 h. The merged images of LDL and nuclei are shown on the left, those of Lamp1 and nuclei are shown in the middle, and those of LDL, Lamp1, and nuclei are shown on the right. The rightmost column presents the higher-magnification images of the boxed regions in the second right column. Scale bars: 10 µm. (B) Intensity of LDL in Lamp1-positive vesicles. The graph shows the values of the fluorescent intensities of LDL in Lamp1-positive vesicles per cell relative to those of LDL in Lamp1-positive vesicles per cell in mock-treated control cells for 6 h. The means and SDs of the value acquired in five view fields are shown. Asterisks indicate a significant difference compared with the control at the same time point (Student’s t-test, p<0.05).

