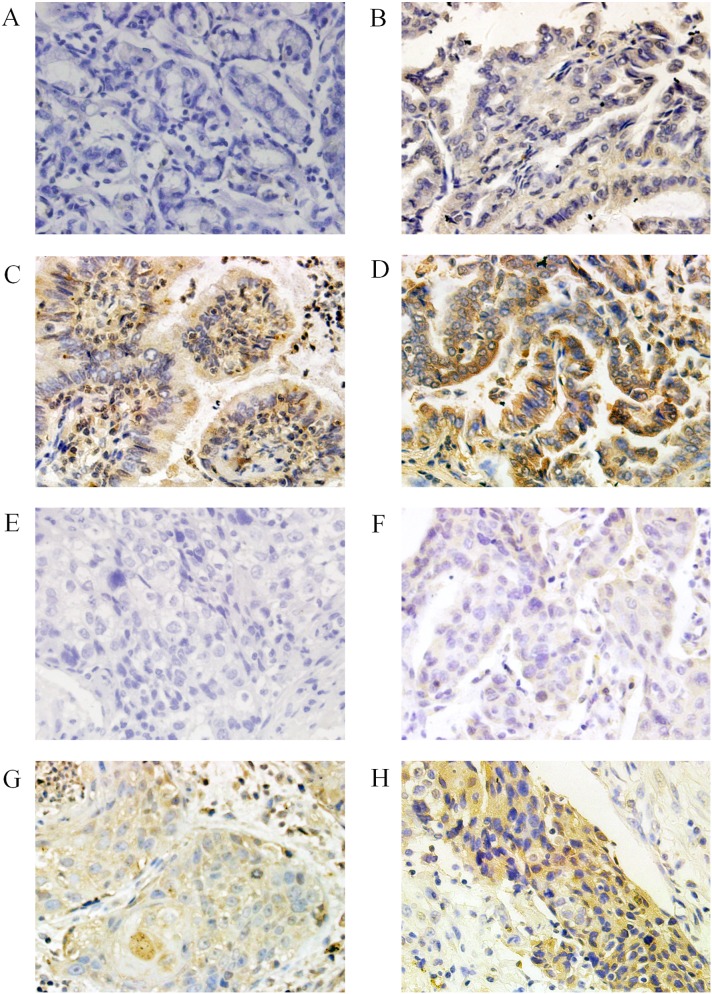
Figure 1. Immunohistochemical staining for THOP1 in NSCLC specimens.
Various intensities of THOP1 protein expression in adenocarcinoma, negative expression (A), with weak (B), moderate (C), and strong (D) expression. Various intensities of THOP1 protein expression in squamous cell cancer, negative expression (E), with weak (F), moderate (G), and strong (H) expression.

