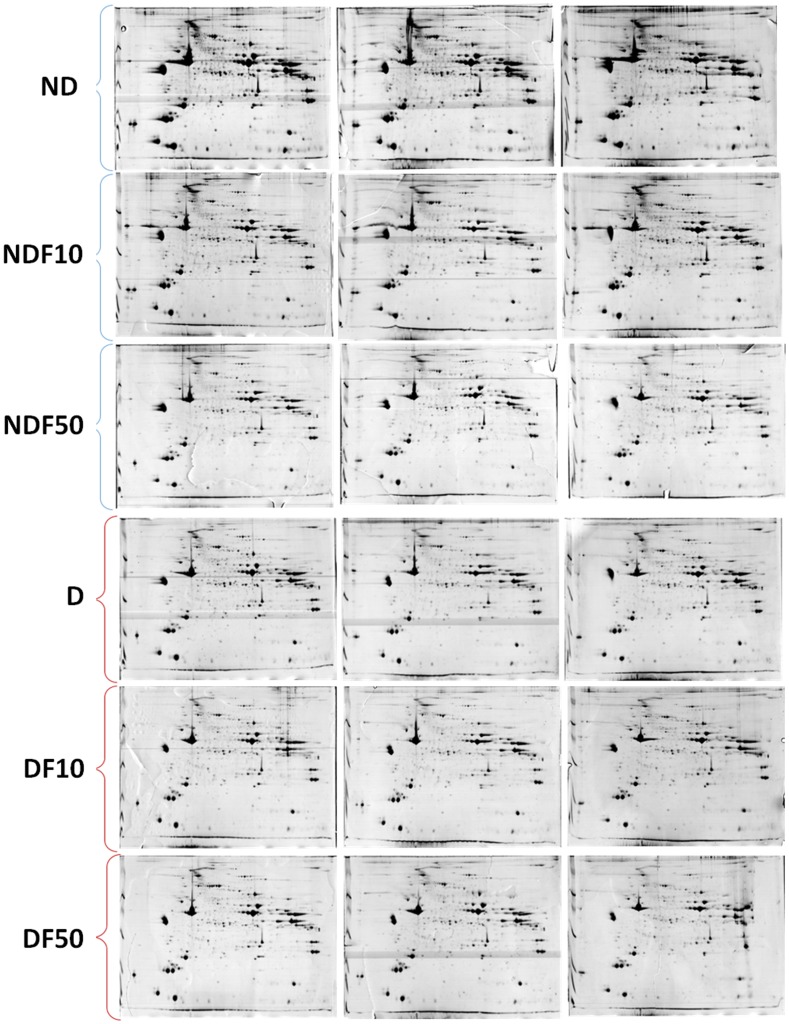
Figure 1. Profile of skeletal muscle proteins of diabetic rats treated with 0 ppm F (D0), 10 ppm F (D10) and 50 ppm F (D50), and of non-diabetic rats treated with 0 ppm F (ND0), 10 ppm (ND10) and 50 ppm F (ND50) in the drinking water for 22 days.
IEF was performed using 24 cm immobilized linear pH 3–10 gradient strips, followed by SDS-PAGE with 12.5% polyacrylamide gels in the second dimension. Resolved proteins were visualized with Colloidal CBB G-250. Each 2-DE gel was performed from samples pooled from six animals for each group. The gels were done in triplicate.

