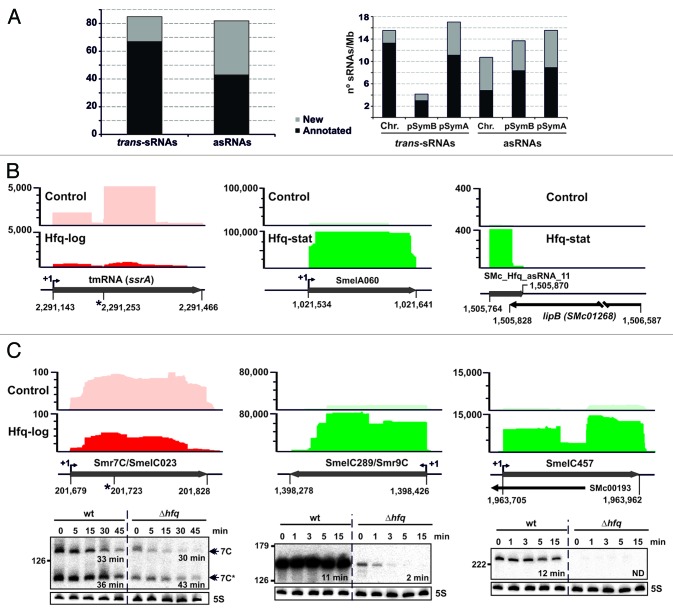
Figure 2. Identification of Hfq-associated sRNAs. (A) Number of annotated and newly identified trans-sRNAs and asRNAs scored as Hfq-bound and their replicon distribution in S. meliloti. Latter values are relative to the sizes (Mb) of chromosome (Chr.) and megaplasmids pSymB and pSymA. (B) IGB visualization of the clone distribution over selected Hfq-dependent and -independent sRNAs. Shown are cDNA clusters corresponding to tmRNA (ssrA), SmelA060 (trans-sRNA), and SMc_Hfq_asRNA_11 (asRNA) in control and Hfq CoIP–RNA as indicated. The vertical axis indicates the number of sequencing reads that were obtained. Relevant genomic information for each sRNA is provided in the schematics below the plots. The asterisk indicates the tmRNA processing site. (C) Selective stabilization of CoIP-enriched sRNAs by Hfq. Northern analysis of Smr7C, SmelC289, and SmelC457 decay in Sm2B3001 (wt) and its hfq deletion mutant derivative (∆hfq) upon transcription arrest with rifampicin. Samples of exponentially growing bacteria in TY were withdrawn prior to or at the indicated time-points (in min) after antibiotic addition. Hybridization signal intensities were normalized to those of the 5S rRNA in each RNA sample to calculate the half-life of the transcripts (indicated in min). IGB plots for these sRNAs (as in B) are shown above each panel.

An official website of the United States government
Here's how you know
Official websites use .gov
A
.gov website belongs to an official
government organization in the United States.
Secure .gov websites use HTTPS
A lock (
) or https:// means you've safely
connected to the .gov website. Share sensitive
information only on official, secure websites.
