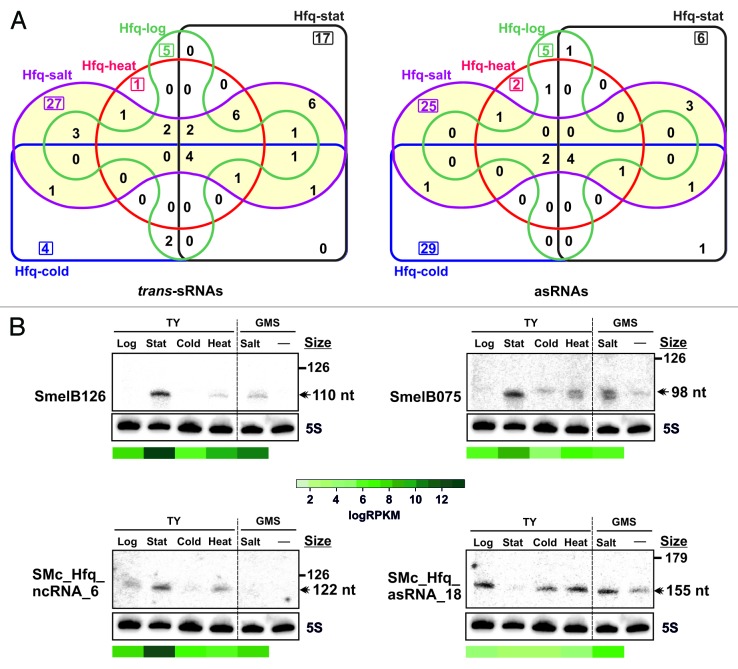
Figure 3. Expression profiling of the Hfq-dependent sRNAs. (A) Venn diagrams indicating the number of Hfq-bound trans-sRNAs and asRNAs identified in each CoIP–RNA library. (B) Northern analysis of the expression of selected Hfq-bound sRNAs. Total RNA was obtained from strain Sm2B3001 grown in the conditions of CoIP experiments. Growth in GMS medium was included as the reference for osmotic upshift induction. Sizes of each transcript as inferred from RNAseq data are indicated with a double arrowhead to the right. RPKM-normalized recovery rates of these sRNAs in each Hfq CoIP–RNA library were plotted under the blots according to the color scale shown in the middle.

An official website of the United States government
Here's how you know
Official websites use .gov
A
.gov website belongs to an official
government organization in the United States.
Secure .gov websites use HTTPS
A lock (
) or https:// means you've safely
connected to the .gov website. Share sensitive
information only on official, secure websites.
