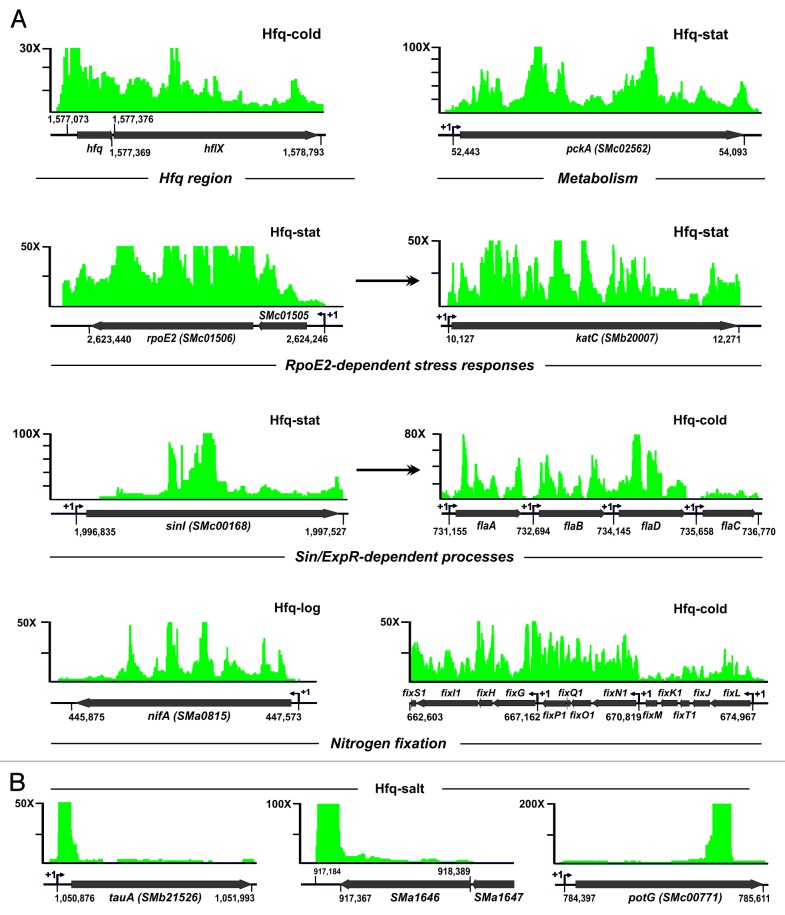
Figure 5. Enrichment patterns of Hfq-associated RNA species derived from mRNAs. (A) Recovery of mRNAs of major metabolic, stress, and symbiotic pathways. The clone distribution over the mRNAs is represented by an IGB stairstep diagram of fold enrichment in the indicated Hfq–CoIP RNA with respect to the control CoIP. The vertical axis indicates the enrichment factors. ORFs of the mRNAs are shown by arrows under each IGB plot. Numbers denote genomic positions of the recovered transcripts according to Table S3. TSSs are indicated if known. (B) Alternative distribution patterns of cDNA clusters over Hfq-bound mRNAs. Information has been diagrammed as in (A). Data correspond to the recovery of these three mRNAs in the Hfq-salt library.

An official website of the United States government
Here's how you know
Official websites use .gov
A
.gov website belongs to an official
government organization in the United States.
Secure .gov websites use HTTPS
A lock (
) or https:// means you've safely
connected to the .gov website. Share sensitive
information only on official, secure websites.
