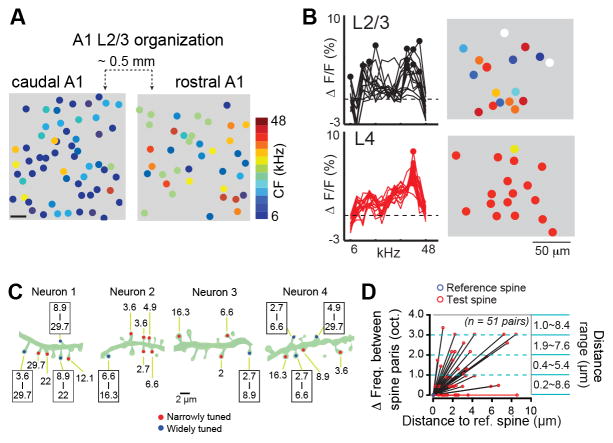
Figure 2. Evidence for disorder: Single cell imaging shows heterogeneity in supragranular layers.
A) Reconstruction of two imaging sites from layer 2/3 in one mouse. Characteristic frequency (CF, frequency tuning at threshold) for each cell illustrates both the local heterogeneity at local scales and a coarse tonotopic organization at larger spatial scales (for further details, see [7]). Scale bar 10um. B) Fractional changes in fluorescence measured from a single imaging site in layer 2/3 and a second imaging site from layer 4 of the same column illustrates the shift from homogeneous to heterogenous frequency tuning between the thalamic input layers and superficial layers (for further details, see [75]. The precise low-resolution tonotopy observed with microelectrode recordings from layer 4 (Fig. 1c) is therefore well matched with the coarse tonotopy over large spatial scales in layer 2/3 (Fig. 2a) and the similar frequency tuning organization within local layer 4 ensembles (Fig. 2a, bottom). C) The bandwidth and center frequency of Ca2+ response-based sound tuning between neighboring spines on a single dendrite are highly heterogenous. Cartoons depict dendritic segments from four layer 2/3 neurons, with numbers indicating the effective range of tone frequencies for each spine. Narrowly tuned and widely tuned spines are indicated by red and blue dots, respectively. D) Plot of the distance between neighboring sound-responsive spines versus their best frequency (for further details, see [67]).

