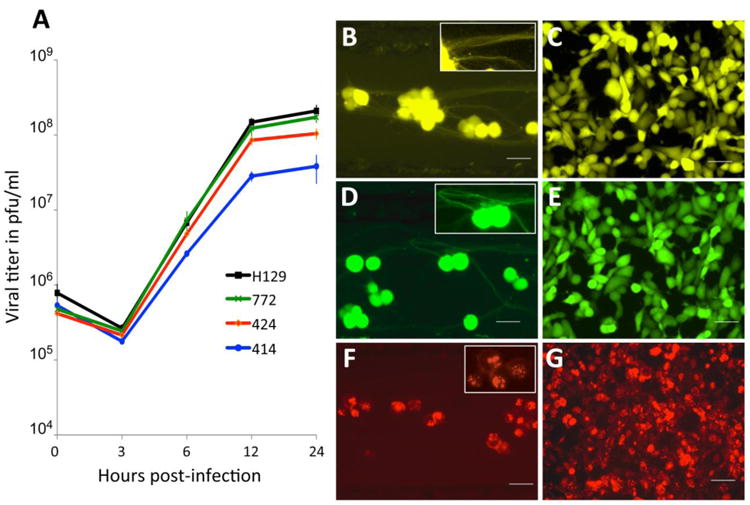
Figure 1.

In vitro characterization of HSV-1 H129 recombinants. Single step growth curves for unmodified H129 and recombinants 414, 424 and 772 were measured. Vero cells were infected with each virus at an MOI of 10 and harvested at 0, 3, 6, 12 and 24 hpi. Viral titers expressed in pfu/ml were determined in Vero cells by limiting dilution and each point represents the average of triplicate assays with the standard deviation. The fluorescent profile of each recombinant infecting either SCG neurons (B, D and F) or Vero cells (C, E and G) is shown in B and C for 414, D and E for 772, and F and G for 424. The higher magnification insets illustrate fluorescent labeling in axons (B and D) or cell bodies (B, D, & F). Scale bar = 50 μm.
