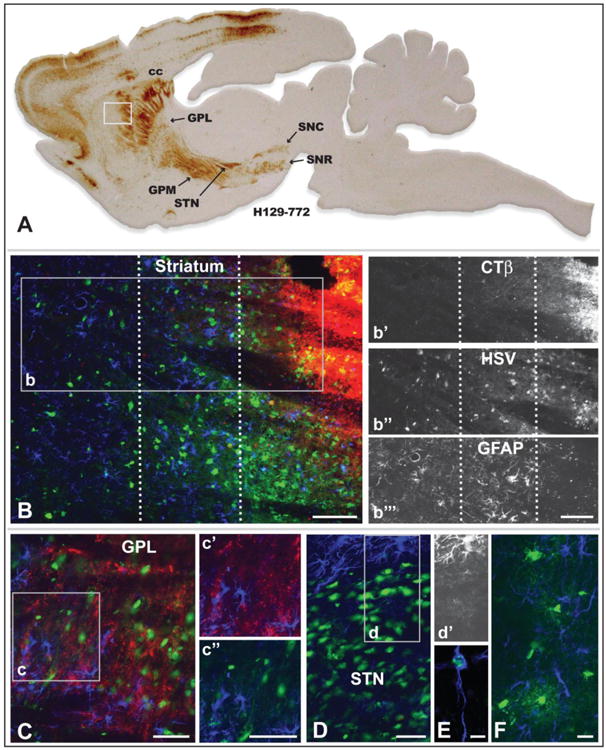
Figure 7.

Reactive gliosis and non-neuronal infection in relation to infected neurons 72 hours after injection of a cocktail of recombinant 772 and CTβ into striatum is illustrated. Figure A is of a parasagittal plane through the neuraxis revealing the distribution of viral antigens localized with immunoperoxidase procedures. The white box in A illustrates the location of image B, which illustrates the distribution of CTβ (red fluorescence), viral antigens (green fluorescence), and GFAP-labeled astrocytes (blue fluorescence) localized by immunofluorescence in an adjacent section. The dotted lines in B define 3 zones distinguished by the differential distribution of CTβ, primary versus secondary spread of infection, and differing degrees of reactive astrogliosis. Individual channels for CTβ, HSV and GFAP in area b are shown in b′, b″, & b″′, respectively. Note that the primary site of first-order infection marked by the dense deposit of CTβ is distinguished by a dense aggregation of infected neurons and the down-regulation of the GFAP phenotype in reactive astrocytes (Fig. b″′). In the immediately adjacent region GFAP immunoreactivity reveals densely packed reactive astroglia exhibiting hyperplastic cell bodies and densely stained thick processes (Fig. b″′). Reactive astrogliosis is less marked in the zone most distant from the site of injection and is most prominent in relation to infected neurons (Fig. b″′). Figure C demonstrates that reactive astrogliosis is present throughout the primary site of infection in the lateral subdivision of globus pallidus. GFAP+ astroglia in the region of the inset are shown either in relation of CTβ labeled striatal axons or infected neurons. In contrast to GPL, the dense aggregation of infected neurons in the subthalamic nucleus (STN; image D) exhibits a GFAP phenotype similar to the site of recombinant injection in the striatum; e.g., the GFAP phenotype in reactive astroglia among infected STN neurons is down regulated while reactive astroglia in the area immediately surrounding the STN are densely immunopositive for GFAP. This is clearly apparent in image d′, which selectively illustrates the channel for GFAP immunoreactivity. A subset of reactive astroglia also become infected and replicate virus (E), as do oligodendrocytes within the corpus callosum (F) and other myelinated fiber pathways involved in the anterograde spread of infection. See text for a more detailed discussion. Marker bar in B and insets = 100 um, marker bars for C and areas of inset = 50 μm, marker bar for D = 50 μm with D and d′ the same magnification, marker bar for E = 7.5 μm, marker bar for F = 20 μm.
