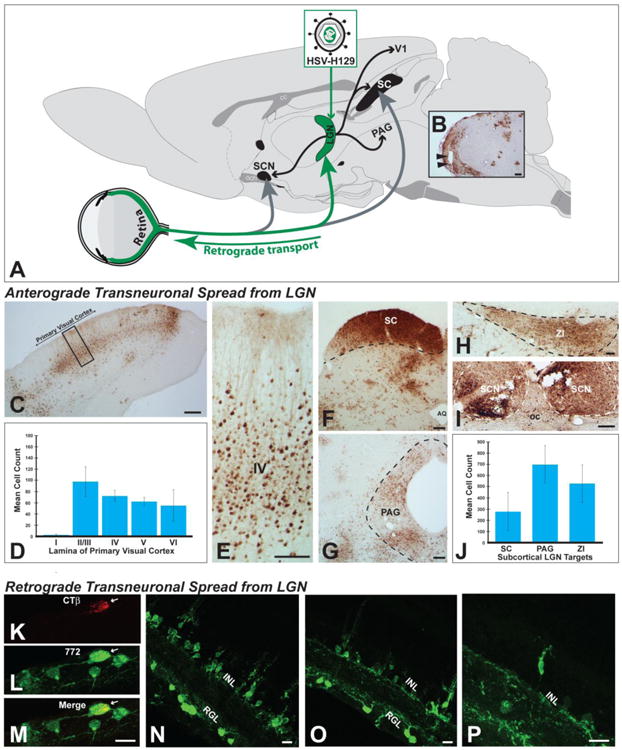
Figure 9.

Anterograde and retrograde transneuronal infection of H129 and its recombinants in visual circuitry are illustrated. Figure A illustrates the experimental paradigm used for these assessments. Virus was injected into the lateral geniculate complex (LGN) and transneuronal infection was evaluated in the retina and in CNS cell groups innervated by LGN subdivisions. Injections centered in the LGN infected all subdivisions of the complex (dorsal lateral geniculate, ventrolateral geniculate, & intergeniculate leaflet; Fig. 9B). All central cell groups that receive projections from these LGN subfields exhibited infected neurons. These included the primary visual cortex (Figs. 9C & D) and the superior colliculus (SC; Fig. 9F), periaqueductal gray (Fig. 9G), zona incerta (Fig. 9I), and suprachiasmatic nuclei (Fig. 9I). Quantitative analysis revealed large numbers of neurons within each of these projection fields (Figs. 9D & J). Evidence for further anterograde transneuronal spread of virus from these cell groups was also observed. Retinal ganglion cells that project densely to all LGN subdivisions were also infected in each case. Figures K – M illustrate an infected RCG that retrogradely accumulated CTb and was infected by 772 after injection of a cocktail of these tracers into LGN. Figures N – P illustrate retrograde transneuronal spread of virus from retinal ganglion neurons that is largely confined to the inner nuclear layer of the retina. See text for more extensive discussion. Abbreviations: AQ = cerebral aqueduct, GCL = ganglion cell layer, INL = inner nuclear layer, oc = optic chiasm, PAG - periqueductal gray, SC = superior colliculus, SCN = suprachiasmatic nuclei, ZI = zona incerta. Marker bars for B, C, F & G = 200 μm, marker bar for D & I = 100 μm, marker bar for H = 50 μm, marker bars for K -P = 15 μm.
