
Figure 1.
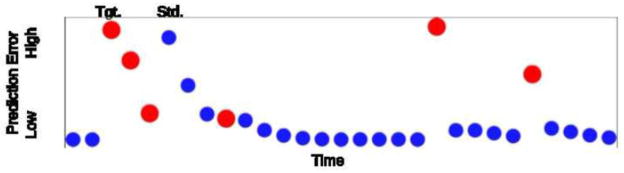
A series of frequent (standard; small blue circles) and infrequent (target; large red circles) tones are depicted. The position along the x axis indicates the position of the tone in time, and the position along the y-axis indicates the modeled prediction error of each tone given the recent history of tones presented, as described in the Methods 2.5.