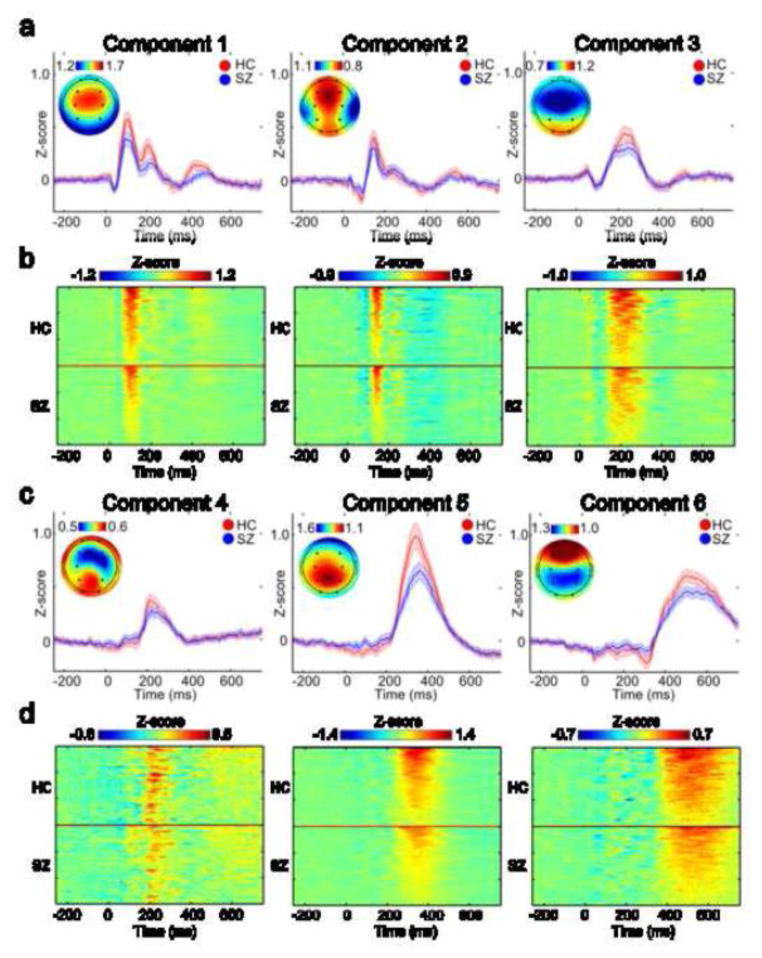
Figure 2.
Average and individual Component ERP responses to tones. The average ERP response to targets is shown in (a) for HC (N = 59) (red) and SZ (N = 59) (blue). The error bars represent the 95% confidence interval. The topographic plots indicate the average spatial loadings (118 subjects) for each group temporal component. The large black circles within each topographic plot denote electrodes Fp1, Fp2, F3, F4, C3, C4, P3, P4, O1, and O2 (from top left to bottom right). The average back reconstructed response to tones is indicated for each subject in (b). Each row represents the response for an individual subject. The HC group is displayed above the solid line and the SZ group is displayed below the solid line. The individual responses are organized for each group with the largest differences on top. The graphs are repeated for components 4, 5, and 6 in c and d.

