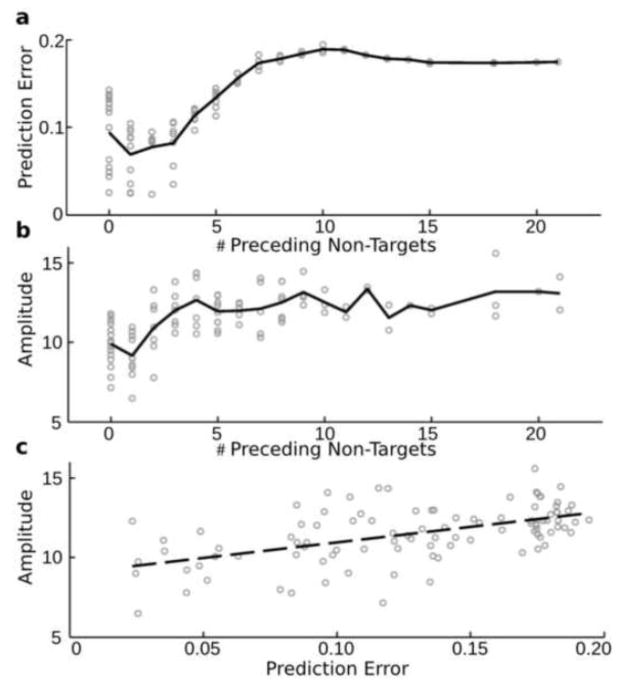
Figure 3.
Estimated prediction error and observed target amplitudes as a function of preceding non-targets. The prediction error (y-axis) is indicated for all stimuli (excluding the first 9) as a function of the number of previous non-targets (x-axis) in a. The amplitude (y-axis) is plotted in b, and c, for component 5 against the number of preceding non-targets (in b) or against the prediction error (in c). The solid lines indicate the average level of prediction error (in a) or the average amplitude (in b) for the particular x axis value. The dotted line in c indicates the linear fit between amplitude and prediction error.

