Figure 4.

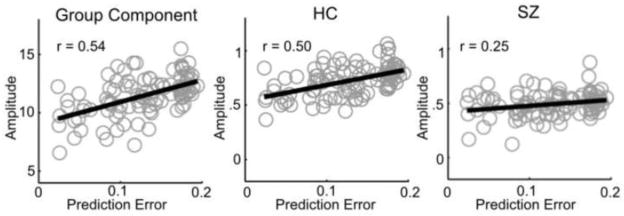
Sensitivity to prediction error. The amplitude to each target tone is plotted (y-axis) against the prediction error of the tone (x-axis) for component 5 (left) and for the component 5 reconstructed data in HC (middle) and SZ (right).

Sensitivity to prediction error. The amplitude to each target tone is plotted (y-axis) against the prediction error of the tone (x-axis) for component 5 (left) and for the component 5 reconstructed data in HC (middle) and SZ (right).