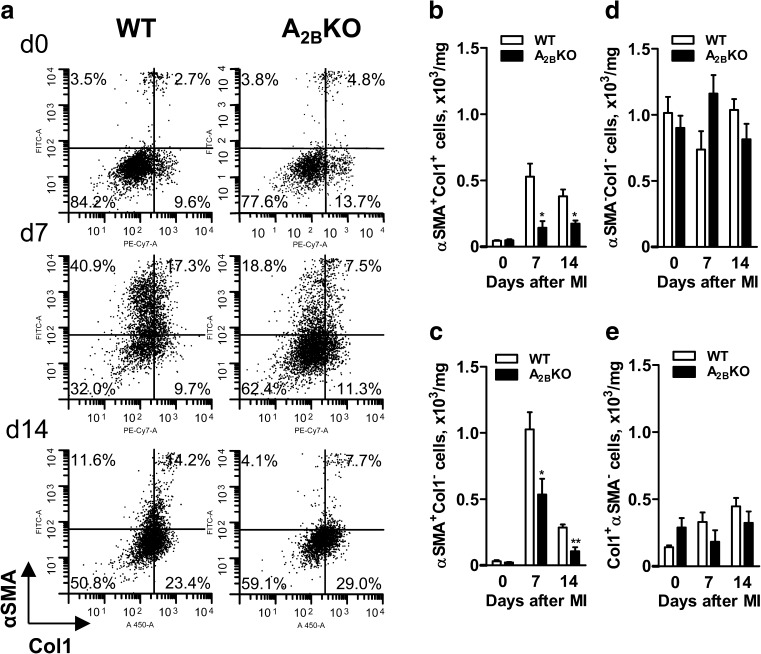
Fig 6.
Comparative analysis of MI-induced changes in αSMA and collagen I expression in cardiac Sca1+CD31− stromal cell populations of WT and A2BKO ventricles. Representative cytofluorographic dot plots (a) of intracellular αSMA and collagen I (Col1) expression in cardiac Sca1+CD31− stromal cell populations obtained from ventricles of WT and A2BKO hearts before (d0) and on days 7 (d7) and 14 (d14) after MI. The numbers of αSMA+Col1+ (b), αSMA+Col1− (c), αSMA−Col1− (d), and Col1+αSMA− (e) cells per milligram of tissue are presented as means ± SEM of 4 animals in each group. Asterisks indicate statistical differences (*p < 0.05, **p < 0.01) between corresponding WT and A2BKO values analyzed by one-way ANOVA with Bonferroni post-hoc tests

