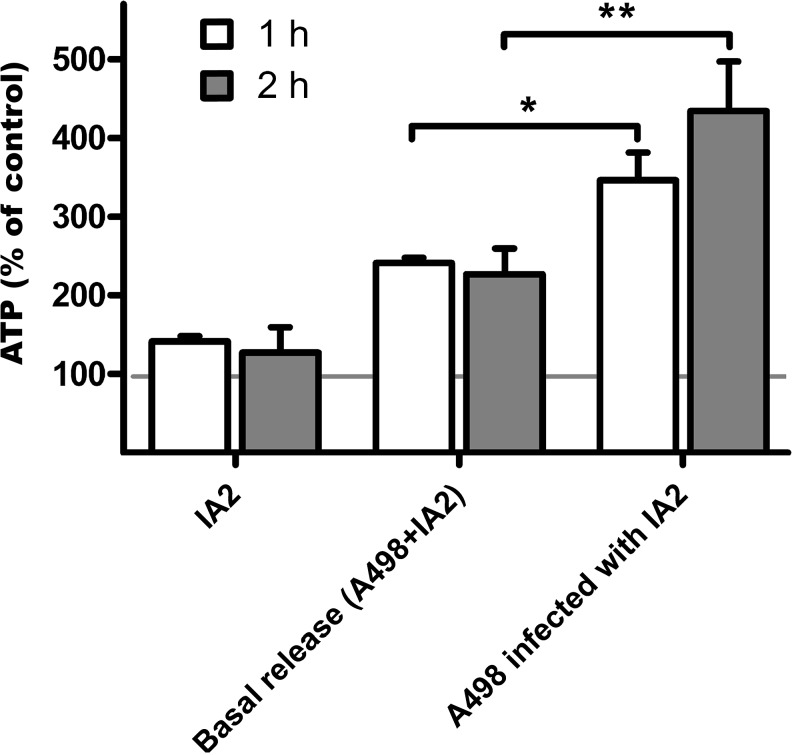
Fig. 1.
ATP release by UPEC strain IA2 and by A498 upon IA2 infection. ATP measured in supernatant after 1 and 2 h IA2 (108 CFU/mL) stimulation of A498 cells. Uninfected A498 cells were used as controls, and IA2 alone, in absence of A498 cells, was used in order to evaluate ATP levels generated by UPEC per se. The basal release is the sum of both uninfected A498 cells and IA2 alone. Data are expressed as mean percentage of control ± SEM with control (uninfected A498 cells) shown as the horizontal line at 100 % corresponding to 1.2 pM ATP. Asterisk represents significance compared to basal release from A498 cells and IA2 alone (n = 4)

