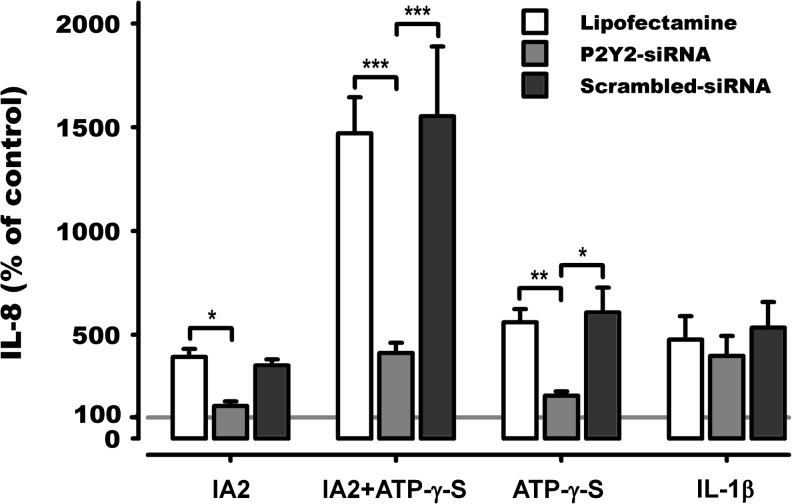
Fig. 3.
IA2- and/or ATP-γ-S-induced release of IL-8 after P2Y2 knockdown. IL-8 measured in supernatant after 5 h IA2 (108 CFU/mL) and/or ATP-γ-S (20 μM) or IL-1β (10 ng/mL) stimulation of A498 cells. Cells had, prior to stimulation, been transfected with either lipofectamine alone or in combination with P2Y2 specific siRNA. Data was normalised to obtain the actual effect of P2Y2 knockdown and are expressed as mean percentage of control ± SEM with control shown as the horizontal line at 100 %. Asterisk represents significance between groups indicated by brackets (n = 3)

