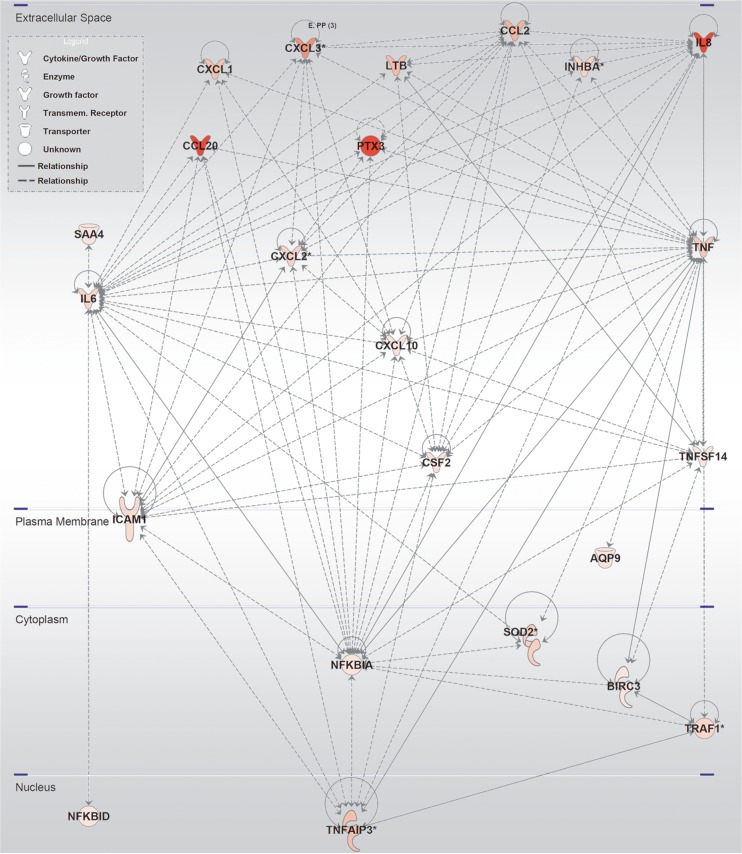
Fig. 5.
IPA-derived stimulation network of the shared gene entities altered with both IA2 and/or ATP-γ-S stimulations. Molecular biological relationships (lines) are shown between molecules (nodes) with altered gene expression of their corresponding gene entity. The intensity of the node colour indicates the degree of upregulation (red). Nodes are derived from IPA analysis of the 36 shared entities of R2 in Fig. 4

