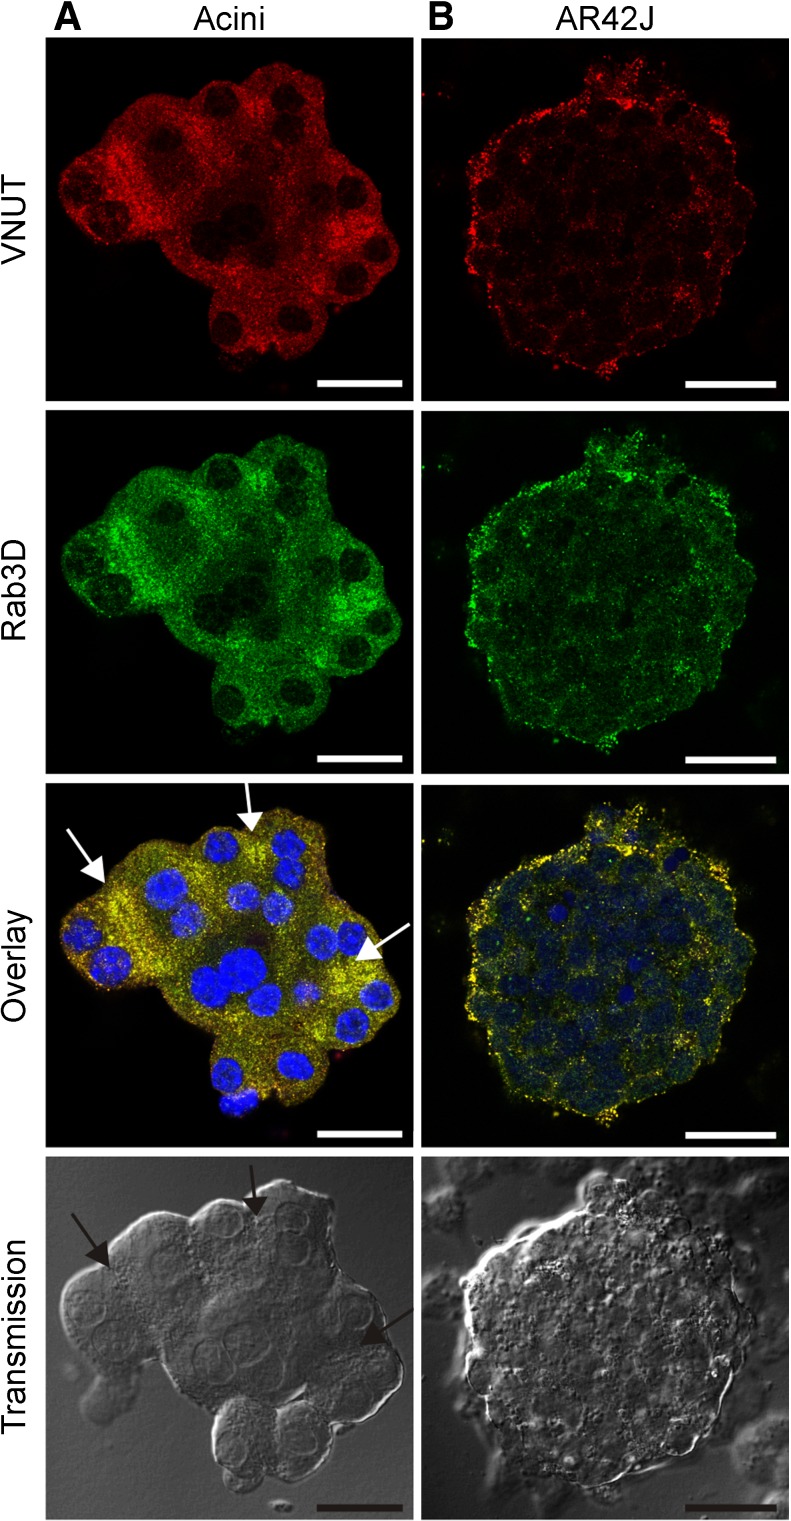
Fig. 1.
Co-localization of VNUT and Rab3D. Acini isolated from mouse pancreas are shown in the first column (a), and AR42J cells treated with dexamethasone are shown in the second column (b). Both cell preparations were stained with VNUT and Rab3D antibodies. Secondary antibodies were conjugated to Alexa 568 (red) for VNUT and Alexa 488 (green) for Rab3D; nuclear stain was DAPI (blue). Transmission images are shown in the last row. Arrows in overlay and transmission images in a indicate acinar lumens. Representative images are of three independent experiments. Scale bars are 25 μm

