Fig. 6.
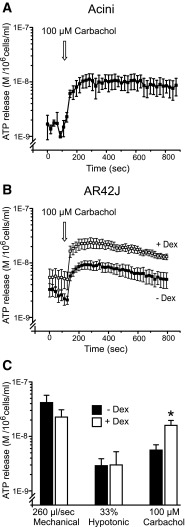
ATP release in response to carbachol in acini and AR42J cells with/without dexamethasone. a ATP release in response to carbachol in freshly isolated acini (n = 3). b ATP release in AR42J +/− dexamethasone (n = 5). c Bar graph presentation of ATP release for all different stimuli from AR42J ± dexamethasone (n = 5). The values presented are the stimulus-evoked changes in ATP concentrations ± SEM; that is, the baseline values for each experiment were subtracted from the means peak values induced with mechanical, hypotonic, and carbachol stimulations. * = P < 0.05

