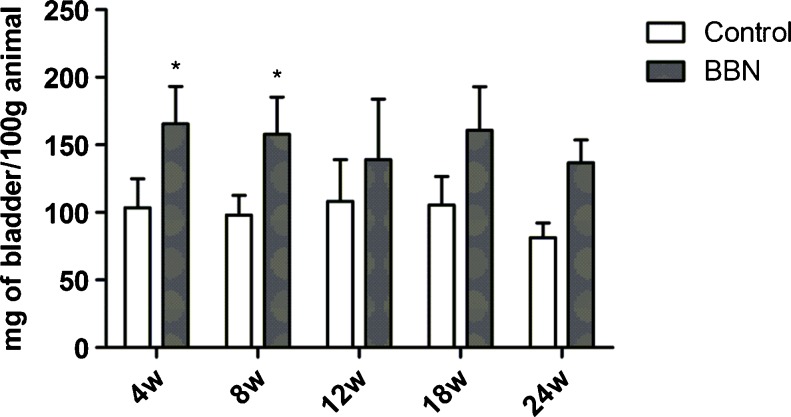
Fig. 1.
Bladder wet weight expressed as mg of bladder/100 g animal to groups which received BBN in different times of cancer induction: 4, 8, 12, 18, and 24 weeks and their respective control groups. Values represent mean ± standard deviation and were analyzed through two-way ANOVA. *Differences between mean values of control and BBN, with p < 0.0001

