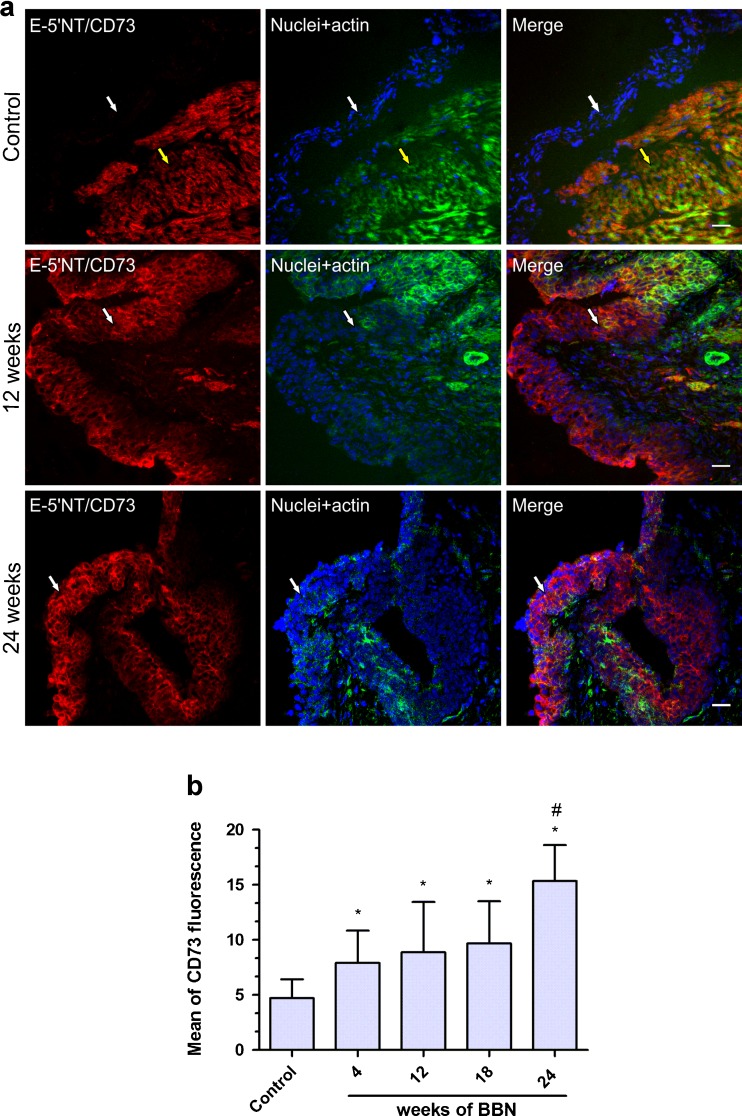
Fig. 4.
a The images correspond to immunofluorescent staining of ecto-5′-NT/CD73 in different times of bladder cancer induction. Cryosections of mouse bladders were labeled with antibody to ecto-5′-NT/CD73 (red), Alexa 488 phalloidin to label actin cytoskeleton (green), and DAPI to label nuclei (blue). Color-merged panels are shown on the right. Pictures correspond to increase of ×400 whose focus was in urothelium (white arrows), but in the control lamina propria and muscle (yellow arrows) can also be observed. White scale bars = 25 μm. b Quantification of ecto-5′-NT/CD73 staining of bladder urothelium from mice which received BBN for 4, 8, 12, 18, and 24 weeks. The immunofluorescent images of ecto-5′-NT/CD73 were quantified in MacBiophotonics ImageJ software as described in Materials and methods. Bars represent mean ± standard deviation of at least 30 mean of fluorescence of Z project acquired from three different animals. The data were analyzed for statistical significance by one-way ANOVA, followed by Tukey post hoc. Differences between mean values were significant at p < 0.001. * Significantly different compared to control. # Significantly different to all other groups

