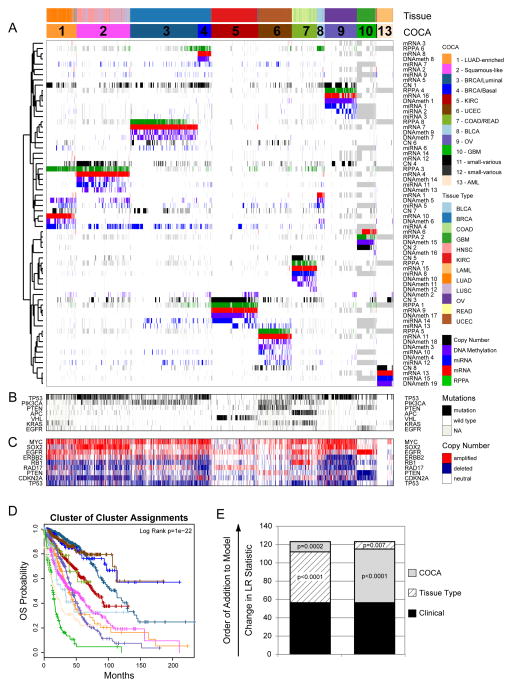
Figure 1. Integrated Cluster-Of-Cluster Assignments analysis reveals 11 major subtypes (see also Supplemental Figures S1-3 and Data Files S1-3).
A) Integration of subtype classifications from 5 “omic” platforms resulted in the identification of 11 major groups/subtypes from 12 pathologically defined cancer types. The groups are identified by number and color in the second bar, with the tissue of origin specified in the top bar. The matrix of individual “omic” platform type classification/subtype schemes was clustered, and each data type is represented by a different color: copy number=black, DNA methylation=purple, miRNA=blue, mRNA=red and RPPA=green. B) Mutation status for each of 10 Significantly Mutated Genes coded as: wild-type=white, mutant=red, missing data=gray. C) Copy number status for each of 9 important genes: amplified=red, deleted=blue, copy number neutral=white and missing data=gray. The color-coding schema is shown to the right. D) Overall survival (OS) of COCA subtypes by Kaplan-Meier plot. COCA subtypes are highly correlated with overall survival outcomes. E) The log-likelihood ratio (LR) statistic was estimated as we added clinical variables, COCA subtype, or tissue type information to a cox proportional hazards model. Clinical variables included age at diagnosis, tumor size, node status and metastasis status. The change in LR statistic as features were added to the model was assessed for significance by chi-square analysis. The set of samples was limited to the set of tumor types that did not have a one-to-one relationship with a COCA subtype: BLCA, BRCA, COAD, HNSC, LUAD, LUSC, and READ in COCA clusters COCA1 – LUAD-enriched, COCA2-Squamous, COCA3-BRCA/Luminal, COCA4-BRCA/Basal-like, COCA7-COAD/READ and COCA8-BLCA. First bar “A” shows results of adding tissue-of-origin to clinical variables already part of the model, followed by a variable representing the COCA subtyping; bar “B” shows results when COCA is first added on to clinical variables, and then tissue-type is added. In each case the increase in the ability to predict OS was in terms of the LR.

