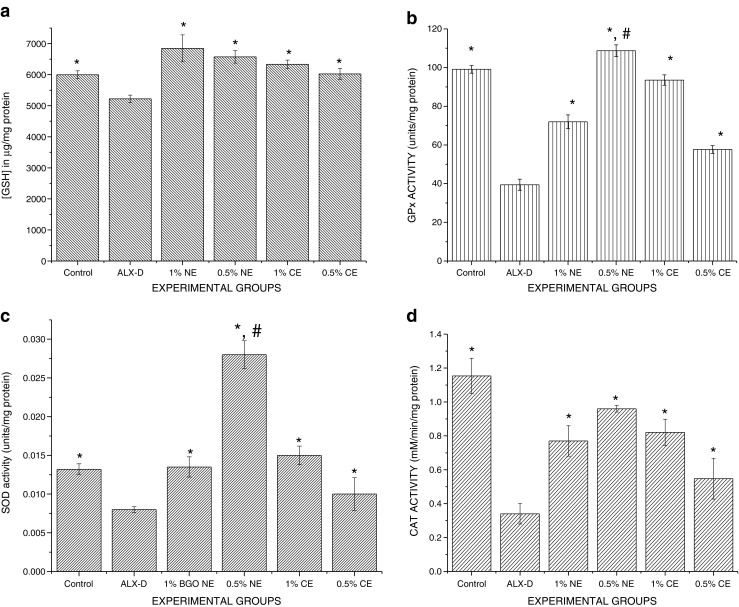
Fig. 5.

Effect of BGO nanoemulsion supplementation on antioxidative biomarkers present in the liver. Values are presented as mean ± SEM (n = 6). a GSH levels: 0.5 % BGO-NE >1 % BGO-NE >1 % BGO-CE>0.5 % BGO-CE>CONTROL>ALLOXAN. b GPx enzyme activity: 0.5 % BGO-NE>CONTROL>1 % BGO-CE>1 % BGO-NE>0.5 % BGO-CE>ALLOXAN. c SOD activity: 0.5 % BGO-NE>1 % BGO-CE>CONTROL ≥ 1 % BGO-NE>0.5 % BGO-CE>ALLOXAN. d CAT activity: CONTROL>0.5 % BGO-NE>1 % BGO-CE>0.5 % BGO-CE>1 % BGO-NE>ALLOXAN. * Experimental groups vs alloxan (ALX-D) group (p < 0.05). # 0.5 % BGO-NE vs other treated experimental groups (p < 0.05).
