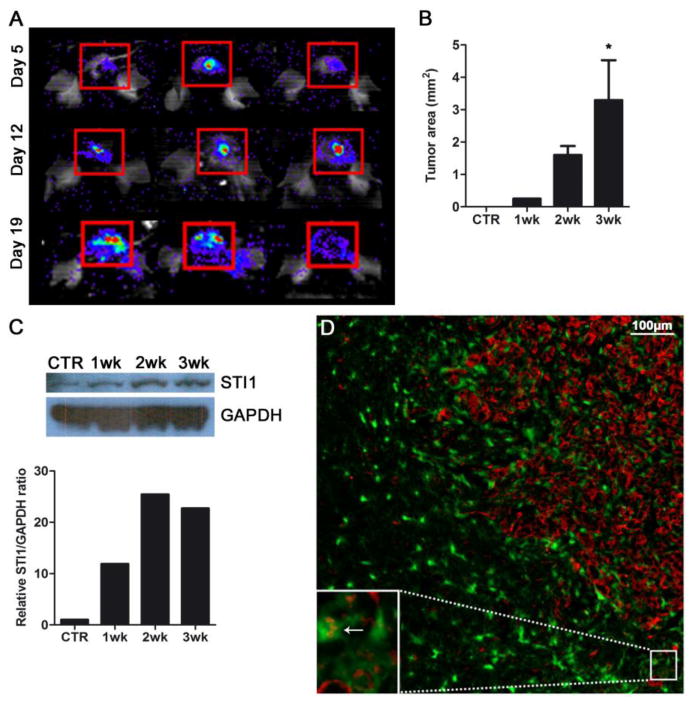
Figure 1. STI1 expression increases with tumor progression.

(A) Representative Xenogen images of three mice 5, 12 and 19 days after tumor implantation. (B) Graph illustrating the tumor size of samples used for STI1 analysis; n=4 animals per group; * p < 0.05. (C) Western blot of normal brain (CTR) and brain tumors 1, 2 and 3 weeks after intracranial injection. All samples probed with anti-STI1 antibody showed a band at the expected molecular weight (66 kDa). (D) A two-week old GL261 glioma in a CX3CR1GFP mouse was immunolabeled with anti-STI1 antibody (red) demonstrating the expression of STI1 by tumor and GAMs (inset, arrow); nuclei were stained with DAPI (blue). Bar, 100 μm. Data is representative of two separate experiments.
