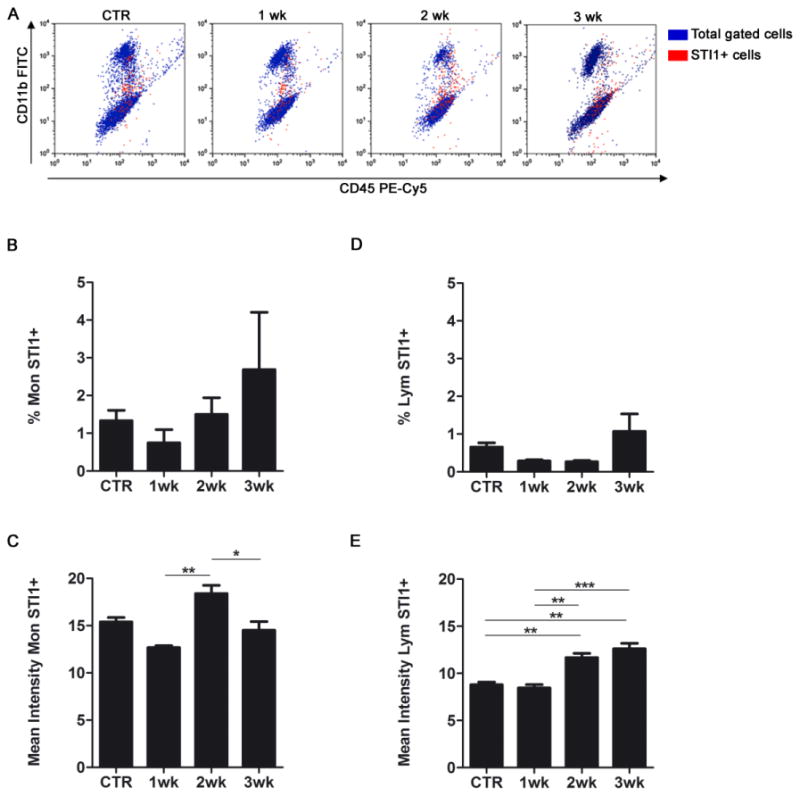
Figure 3. STI1 expression in circulating blood monocytes and lymphocytes in glioma-bearing mice.

(A) Flow cytometry was performed to identify STI1–positive cells (red events) in blood after intracranial GL261 glioma inoculation. Representative dot plots demonstrating the expression of STI1 in monocytes (Mon; CD11b+/CD45high) and lymphocytes (Lym; CD11b−/CD45+) after gating the CD45+ (leukocyte) population. Quantification of the percentage of STI1–positive cells (B and D) and the mean fluorescence intensity (C and E) by cell type; n=4 animals per group; * p < 0.05, ** p < 0.01, *** p < 0.001. Data is representative of two separate experiments.
