
Figure 4. STI1 expression in GAMs and infiltrating lymphocytes is modulated by the brain tumor microenvironment.
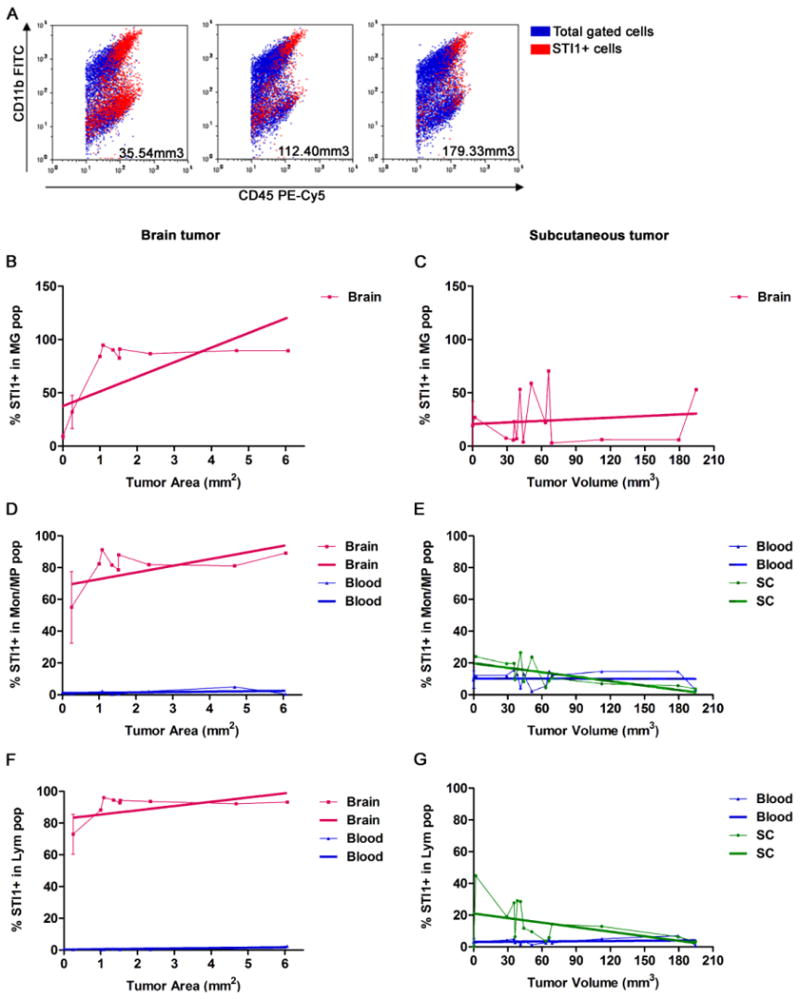
(A) Flow cytometry wasperformed to identify STI1–positive inflammatory cells in GL261 tumors propagated in either the brain or subcutaneous tissue. Representative dot plots demonstrating the expression of STI1 in monocytes/macrophages (Mon/MP; CD11b+/CD45high) and lymphocytes (Lym; CD11b−/CD45+) after gating the CD45+ (leukocyte) population. The size of the tumors is identified in each dot plot. B, D and F: brain tumors (n=15 mice in total); C, E and G: subcutaneous tumors (n=13 mice in total). Y axis: percentage of microglia (MG), monocytes/macrophages (Mon/MP) and lymphocytes (Lym) positives for STI1; X axis: tumor area (mm2) or volume (mm3). Brain, blood and subcutaneous tissue (SC) were analyzed. The thicker lines are the result of a linear regression from each of the curves.