Figure 2.

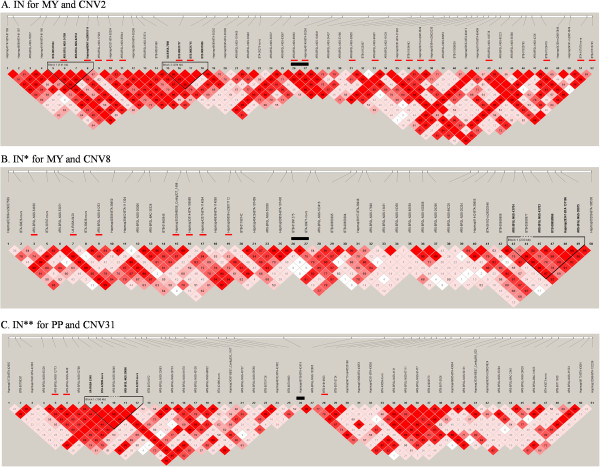
Haplotype analysis of (A) IN for MY, (B) IN* for MY and CNV8 and (C) IN** for PP and CNV31. Black bar represents CNV and red bars represent significant tag SNPs.

Haplotype analysis of (A) IN for MY, (B) IN* for MY and CNV8 and (C) IN** for PP and CNV31. Black bar represents CNV and red bars represent significant tag SNPs.