
Figure 5.
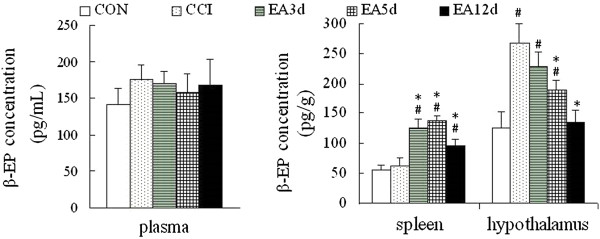
Effect of EA on β-EP concentration. Data are presented as the mean ± SD (n = 10 per group). # P < 0.05 vs the CON group, *P < 0.05 vs the CCI group.
Official websites use .gov
A
.gov website belongs to an official
government organization in the United States.
Secure .gov websites use HTTPS
A lock (
) or https:// means you've safely
connected to the .gov website. Share sensitive
information only on official, secure websites.
Effect of EA on β-EP concentration. Data are presented as the mean ± SD (n = 10 per group). # P < 0.05 vs the CON group, *P < 0.05 vs the CCI group.