
Figure 6.
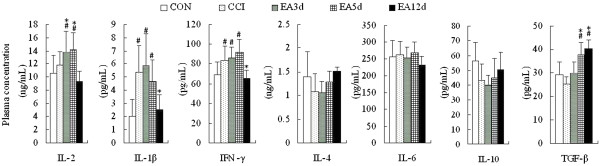
Effect of EA on plasma cytokine concentrations in CCI rats. Data are presented as the mean ± SD (n = 10 per group). # P < 0.05 vs the CON group, *P < 0.05 vs the CCI group.
Official websites use .gov
A
.gov website belongs to an official
government organization in the United States.
Secure .gov websites use HTTPS
A lock (
) or https:// means you've safely
connected to the .gov website. Share sensitive
information only on official, secure websites.
Effect of EA on plasma cytokine concentrations in CCI rats. Data are presented as the mean ± SD (n = 10 per group). # P < 0.05 vs the CON group, *P < 0.05 vs the CCI group.