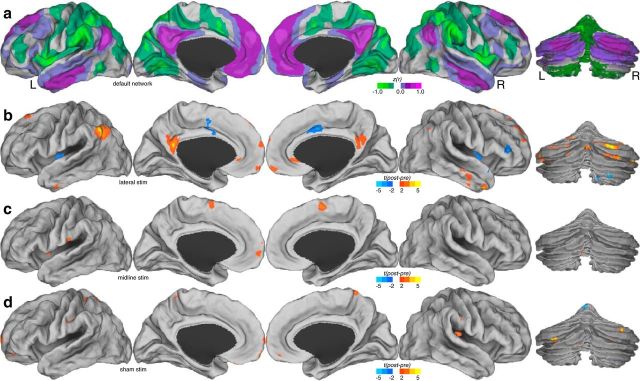
Figure 5.
Voxelwise map of changes before and after stimulation in the default network across experimental conditions. a, Mean baseline functional connectivity (z-transformed Pearson's correlation coefficients) of the default network. b, t statistic of change in functional connectivity for lateral stimulation sessions. c, t statistic of change in functional connectivity for midline stimulation. d, t statistic of change in functional connectivity for sham stimulation. L, Left; R, right.

