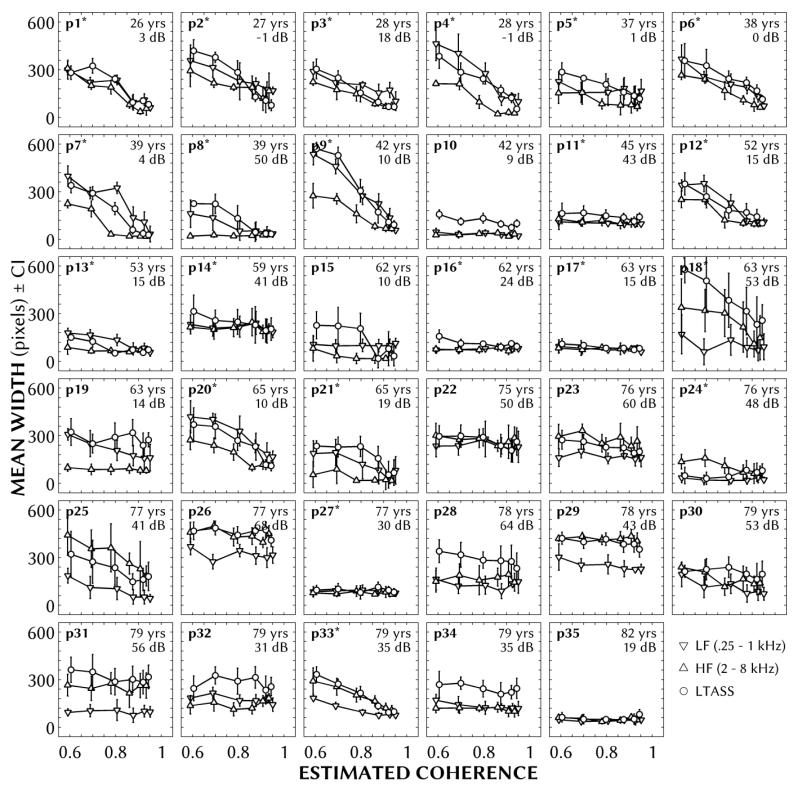
Figure 5.
Normalized mean widths as a function of the measured coherence of stimuli for the three stimulus types: low-frequency noise (250-1000 Hz; downward triangles), high-frequency noise (2000-8000 Hz; upward triangles) and long-term average speech-spectrum noise (LTASS; circles). Error bars show ±1 standard error. Each panel represents a different participant, sorted by age from youngest to oldest (p1-p35). An asterisk next to the participant number indicates that participant was able to complete the binaural TFS task. Participant age and better-ear four-frequency average hearing loss is given in the upper right of each panel.

