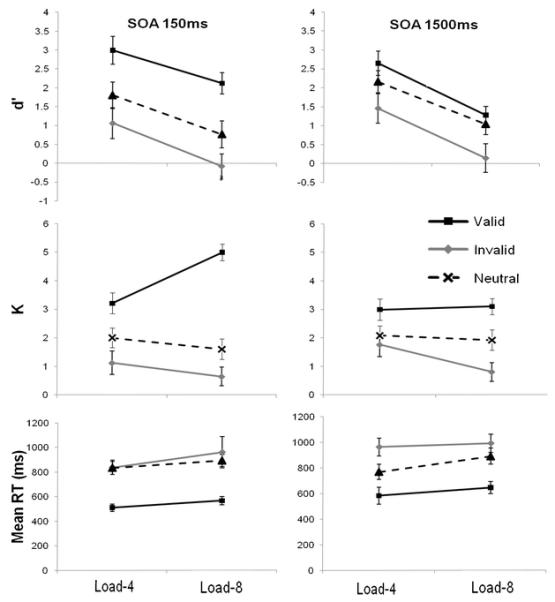
Figure 6.

Results from Experiment 4: the upper two panels show d prime across the two levels of load, for iconic memory (left) and VSTM (right) SOAs, with the three levels of cue validity; the middle two panels show the same comparison for K estimates (the proportion of hits minus proportion of false alarms, multiplied by load); the lower two panels show the same comparison for mean RT. In all cases the error bars show the standard error of the mean.
