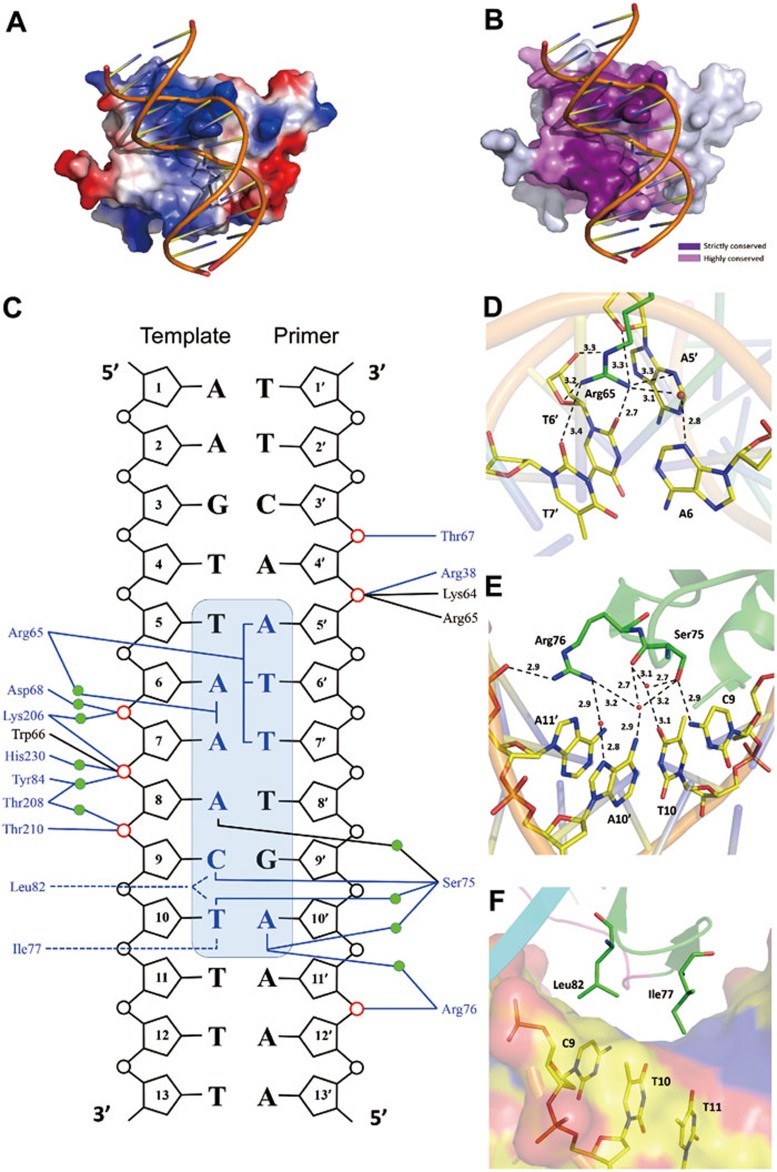
Figure 2.
Interactions between the WOPR domain and the dsDNA. (A) A surface representation of the WOPR-dsDNA complex showing the electrostatic surface of the WOPR domain. The interaction interface of the WOPR domain exhibits a largely positively-charged electrostatic surface which is complementary to the negatively-charged electrostatic surface of the DNA. The bound dsDNA is shown with a coil model in yellow. (B) A surface representation of the WOPR-dsDNA complex showing the residue conservation of the WOPR domain. The residues of the WOPR at the interaction interface are either strictly or highly conserved. (C) A schematic representation of the interactions between the WOPR domain and the dsDNA. Hydrophilic interactions are indicated by blue solid lines and hydrophobic contacts by blue dashed lines. The core motif of the dsDNA is highlighted in a shaded blue box and the bases involved in the interactions are colored in blue. The phosphates involved in interactions with the protein are highlighted in red. The residues interacting with the nucleotides via the side chains and the main chains are colored in blue and black, respectively. Water molecules are indicated by green circles. (D) Hydrophilic interactions between the side chain of Arg65 and the nucleotides A5′, A6, T6′, and T7′ in the minor groove. Water molecules are shown as red spheres. The hydrophilic interactions are shown with dashed lines and distances. (E) Hydrophilic interactions between the side chains of Ser75 and Arg76 and the nucleotides C9, T10, A10′, and A11′ in the major groove. (F) Hydrophobic contacts between the side chains of Ile77 and Leu82 and the nucleotides C9 and T10 in the major groove. The protein is shown in ribbon and the dsDNA in van der Waals surface. Surface of the DNA is colored according to the atom types: carbon in yellow, oxygen in red, and nitrogen in blue, respectively.

