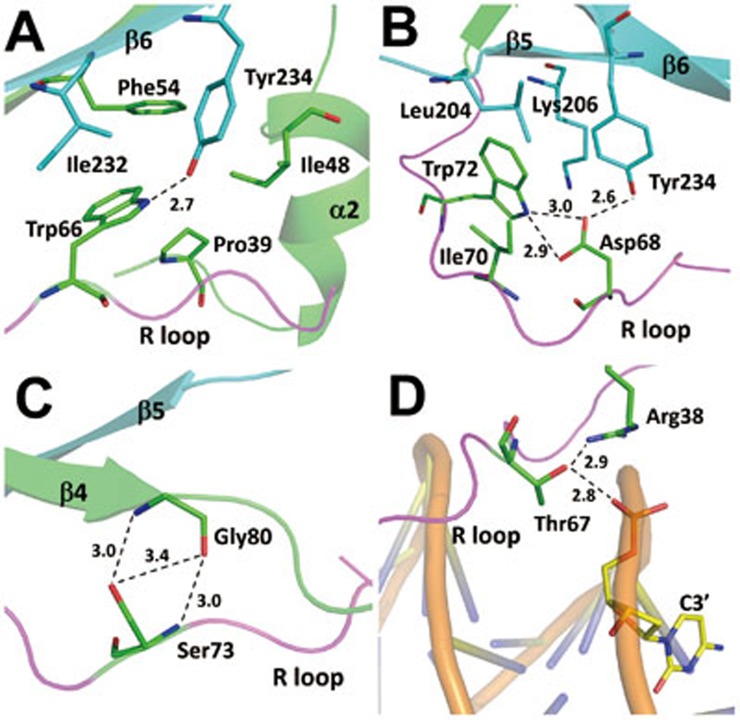
Figure 4.
Stabilization of the R loop. (A) Interactions of Trp66 of the R loop with the surrounding residues. (B) Interactions of Asp68 and Trp72 of the R loop with the surrounding residues. (C) Interactions of Ser73 of the R loop with the surrounding residues. (D) Interactions of Thr67 of the R loop with the surrounding residue and nucleotide. WOPRa and WOPRb are shown as ribbon models and colored in green and cyan, respectively. The R loop is highlighted in magenta. The dsDNA is shown as a coil model and colored in yellow. Hydrogen bonds are shown with dashed lines and distances.

