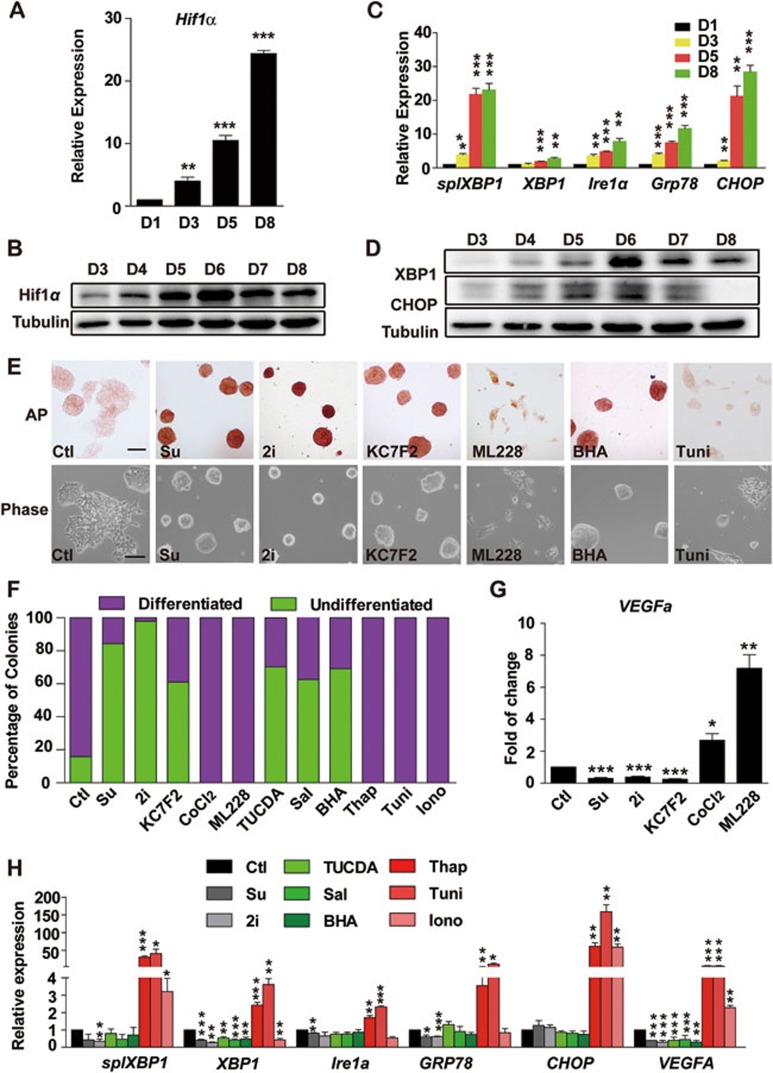
Figure 4.
Role of HIF1α and ER stress in VEGF expression and pluripotency of mESCs. (A, B) qRT-PCR (A) and western blot analysis (B) of HIF1α in E14 cells cultured in mES media containing 1 000 U/ml LIF for 1-8 days. Tubulin served as a loading control for western blot. (C, D) qRT-PCR (C) and western blot analysis (D) of genes involved in ER stress in E14 cells cultured in mES medium containing 1 000 U/ml LIF for 1-8 days. (E) Morphology (bottom) and AP staining (top) of E14 cells cultured in mES medium without LIF but containing sunitinib (1 μM), 2i, ML228 (1 μM), KC7F2 (1 μM), BHA (10 μM) or tunicamycin (Tuni, 2.5 μg/ml) for 48 h. Scale bar, 50 μm. (F) Statistical data of the percent of undifferentiated and differentiated colonies in E14 cells cultured in LIF-free mES medium containing the indicated compounds for 3 days, including sunitinib, 2i, KC7F2 (1 μM), CoCl2 (30 μM), ML228 (1 μM), TUCDA (0.1 mM), salubrinal (Sal, 10 μM), BHA (10 μM), thapsigargin (Thap, 0.4 μM), tunicamycin (Tuni, 2.5 μg/ml) and ionomycin (Iono, 3.6 μM). (G) qRT-PCR analysis of VEGFA in E14 cells cultured in LIF-free mES medium containing sunitinib, 2i or the indicated HIF1α regulators (same concentrations as in F) for 3 days. Data are mean ± SEM (n = 3). *P < 0.05, **P < 0.01, ***P < 0.001 vs control. (H) qRT-PCR analysis of the expression of ER stress-related genes and VEGFA in E14 cells cultured in LIF-free mES medium containing sunitinib, 2i or the indicated ER stress regulators (same concentrations as in F) for 3 days. Data are mean ± SEM (n = 3), *P < 0.05, **P < 0.01, ***P < 0.001 vs control. Independent experiments were repeated at least three times.

