Figure 5.
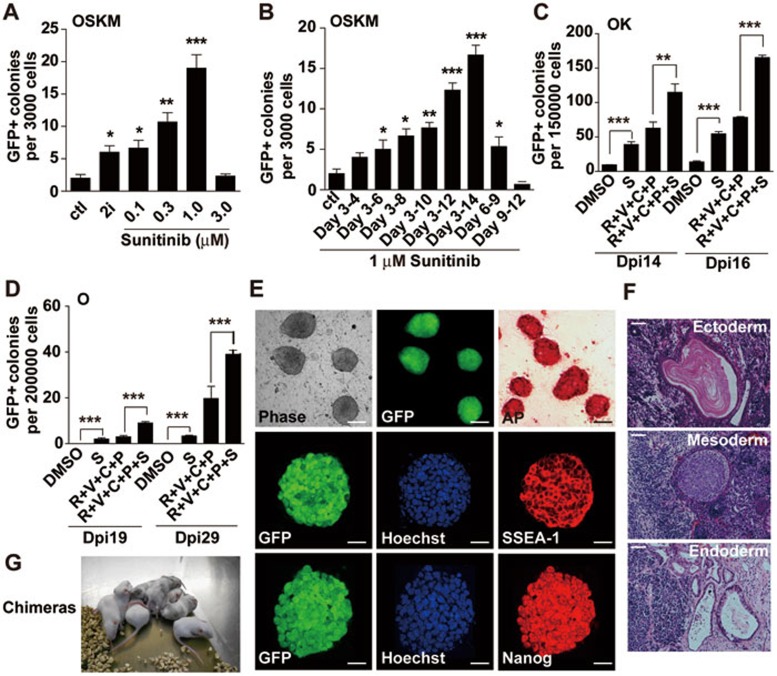
Sunitinib promotes reprogramming of somatic cells. (A) Dose response of sunitinib in 4F-mediated iPSC induction. Sunitinib at the indicated concentration was added into 3 000 4F-transduced MEFs from day 3 to day 14. (B) Time response of sunitinib in iPSC induction. Sunitinib (1 μM) was added at the indicated time periods, and GFP+ colonies were counted on day 14. Data are mean SEM (n = 3). *P < 0.05, **P < 0.01, ***P < 0.001 vs control. Independent experiments were repeated at least three times. (C) Sunitinib facilitated iPSC generation from 2F (OK)-transduced MEFs alone or in combination with several known chemicals. For OK-mediated reprogramming, 150 000 OK-infected cells in 6-well plates were treated with 1 μM sunitinib (S) alone or various combinations of compounds (including 1 μM R, RepSox; 0.5 mM V, VPA; 3 μM C, CHIR and 2 μM P, Parnate) from day 3 to day 14. (D) Sunitinib facilitated iPSC generation from Oct4-transduced MEFs alone or in combination with several known chemicals. For Oct4-mediated reprogramming, 200 000 Oct4-infected cells in 6-well plates were treated with 1 μM sunitinib (S) alone or the indicated combinations of compounds from day 3 to day 14. GFP+ colonies were counted on day 19 and day 29. (E) Top: morphology, GFP expression and AP staining in iPSC clones induced with 1F (Oct4) plus sunitinib (1 μM). Scale bar, 50 μm. Middle and bottom: immunofluorescent staining of SSEA-1 and Nanog in the same clone. Scale bar, 10 μm. (F) HE-stained sections of teratomas formed with iPSC clone described in E. Typical structures of the three embryonic germ layers are shown: epidermis (ectoderm), muscle and cartilage (mesoderm) and epithelium (endoderm). Scale bar, 20 μm. (G) chimeric mice produced with iPSC clone described in E.

