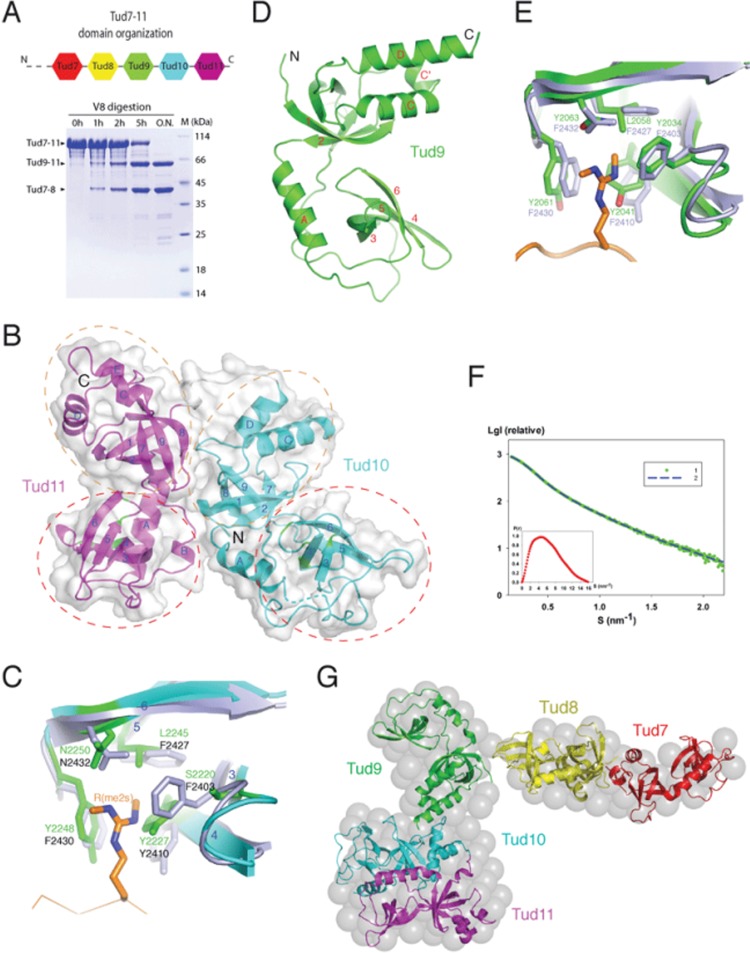
Figure 1.
Structure of Tud7-11. (A) Domain organization of Tud7-11. Top, a schematic diagram showing distribution of eTud modules based on sequence alignment and secondary structure analyses. The domains and their spacing were approximately drawn in scale. Bottom: time course of limited proteolysis with V8 protease generating two stable fragments corresponding to Tud7-8 and Tud9-11. (B) Overall structure of Tud10-11 shown as a ribbon model superimposed with a semi-transparent surface representation. Regions spanning the canonical tudor and OB-fold domains are enclosed in red and brown dashed ovals, respectively. Residues at the putative sDMA-binding pockets are indicated in green. (C) Superposition of the putative sDMA-binding site of Tud10 with that of Tud11 in the Tud11-pep complex. The involved residues are shown in a stick model (light blue for Tud11 and green for Tud10). The Aub peptide bound to Tud11 is shown as a reference, with the sDMA residue shown in a stick model (brown). (D) Overall structure of Tud9. (E) Comparison of the sDMA-binding pockets of Tud9 and Tud11. The Aub peptide bound to Tud11 is shown in brown, with the sDMA residue shown in a stick model. (F) Experimental SAXS curve from Tud7-11 in solution. Green dots represent the experimental SAXS data points. Blue dashed line represents the scattering curve computed from the ab initio envelope. The inset at left bottom corner shows the distance distribution functions p(r). (G) Molecular envelope of Tud7-11. The ab initio low-resolution SAXS-derived envelope is shown in a sphere representation. The crystal structures of Tud9, Tud10-11, and the simulated models of Tud7 and Tud8, all shown in a ribbon representation, were docked into the envelope as rigid bodies.

