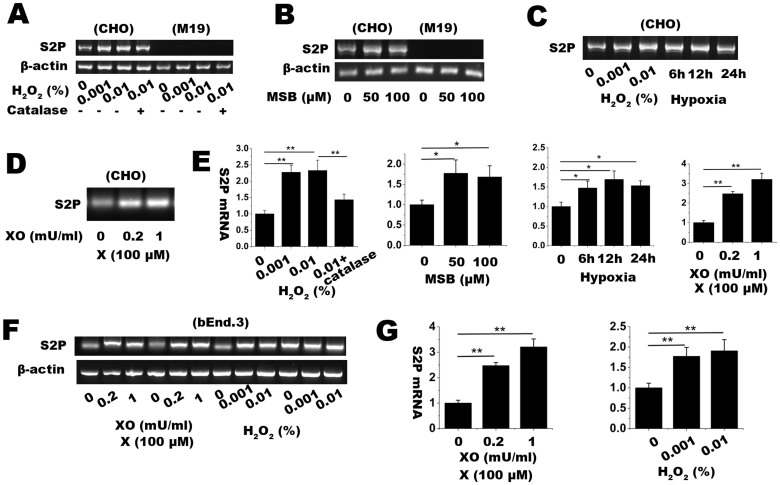
Figure 1. RT-PCR assay for determining relative mRNA expression level of S2P gene in CHO and M19 cells treated with several oxidative stress conditions.
The conditions included (A) 0.001 and 0.01% H2O2 with or without 100 U/ml catalase for 1 h, (B) 50 and 100 μM MSB for 2 h, (C) hypoxia (1% O2 and 5% CO2 balanced with N2) for 6, 12, 24 h, and (D) 100 μM xanthine plus 0.2 or 1 mU/ml xanthine oxidase (X/XO) for 2 h. β-actin was used as internal loading control. (E) S2P mRNA level in oxidative stress conditions were quantified with ImageJ software and shown in bar graph. (F) RT-PCR assay for determining relative mRNA expression level of S2P gene in bEnd.3 cells, a mouse brain microvascular cell line. β-actin was used as internal loading control. (G) S2P expression in bEnd.3 cells were quantified and shown in bar graph. Full length images are presented in supplementary information (Supplementary Figure S1 and S2). The relative fold changes were expressed as mean ± SD, n = 3. * p < 0.05, ** p < 0.01. The results showed that oxidative stress induced S2P mRNA expression in CHO and bEnd.3 cells.

