Figure 3.

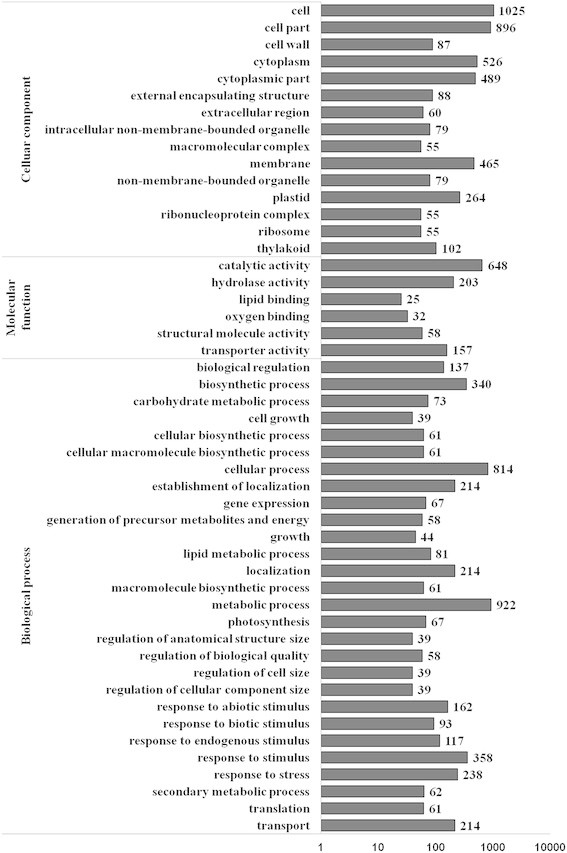
Histogram showing gene ontology functional analysis of DEGs. The y-axis and X-axis indicated the names of clusters and the number of DEGs in clusters, respectively.

Histogram showing gene ontology functional analysis of DEGs. The y-axis and X-axis indicated the names of clusters and the number of DEGs in clusters, respectively.