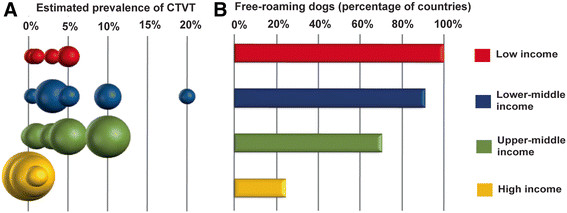
Figure 4.

Factors associated with CTVT prevalence. (A) Relationship between CTVT prevalence and socio-economic status defined as low/lower-middle/upper-middle/high income economies (World Bank, Country and Lending Groups [59]). The size of the dots represents the number of countries with estimated average CTVT prevalence within each interval. CTVT prevalence values represent the upper limit of each categorical interval. (B) Relationship between socio-economic status defined by division into low/lower-middle/upper-middle/high income economies and presence of free-roaming dogs, as reported by respondents to the questionnaire. “Percentage of countries” refers to the proportion of countries within each income category in which the presence of free-roaming dogs was reported by the majority of respondents.
