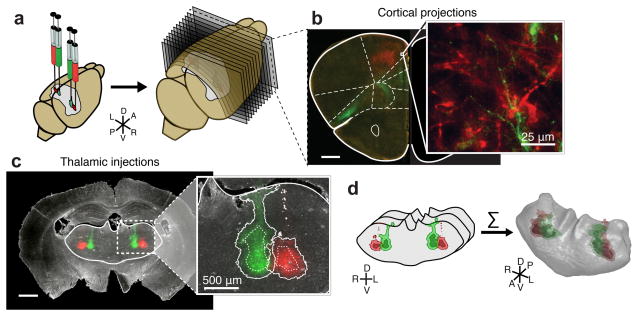
Figure 1.
Systematic mapping of fluorescently labeled thalamocortical projections using high-throughput, high-resolution imaging. (a) Illustration showing bilateral viral injections driving the expression of tdTomato (red) and eGFP (green) in the mouse thalamus (left), followed by sectioning (50 μm/section, right) and high resolution imaging under identical conditions (right). (b) Representative coronal section showing thalamocortical projections to specific frontal subregions, with a zoomed-in image showing that full-resolution images allow the identification of single axons (inset). (c) Example fluorescent image showing viral injection sites on the dark-field image of the brain section (left). Solid white line: the thalamus mask. Zoom-in of the injection sites (right) shows the injection site masks created by intensity thresholding (solid line), as well as the injection site “cores” created by eroding the injection by 100 μm (dashed line) (see Methods). (d) The outline of the thalamus is manually traced in each coronal section and combined with the injection site masks created in panel c. These masks are then stacked to create a 3D representation of each thalamus. All scale bars are 1 mm, unless otherwise indicated. A (anterior), P (posterior), L (left), R (right), D (dorsal), V (ventral) throughout all figures.

