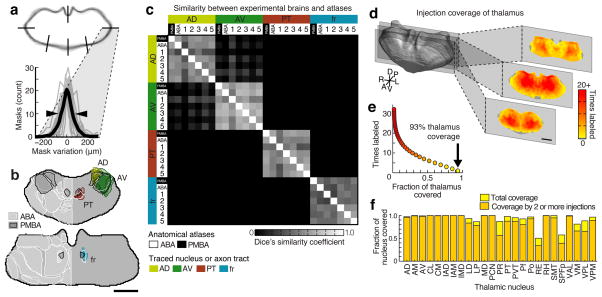
Figure 2.
Assessment of variability across brains, atlas alignment, and injection coverage of the thalamus. (a) Top: aligned coronal thalamus sections from 75 brains (gray outlines). Black lines indicate 6 of 18 line profiles used to calculate thalamus edge variability. Bottom: thalamus edge variability after normalization at 18 locations (gray traces) and their average (black trace, full-width half-maximum = 102 ± 51 μm, arrowheads). (b) Two representative coronal sections through the averaged model thalamus (gray), overlaid with three thalamic nuclei (AD, yellow; AV, green; PT, red) and one axon tract (fr, blue) traced from 5 experimental brains. These atlas structures are also shown for the Paxinos Mouse Brain Atlas (PMBA, black) and the Allen Brain Atlas (ABA, white). (c) Dice’s similarity coefficient across the traced nuclei and axon bundle in 5 experimental animals, the ABA, and the PMBA, showing that each traced structure is well aligned to that same structure in other experimental brains and in each atlas. Data are symmetric across the diagonal. (d) The model thalamus (left) with coronal sections through the model thalamus showing injection coverage within the thalamus (i.e. how many times a voxel is hit by independent viral injections). See Supplementary Fig. 7 for full coverage maps. (e) The fraction of the thalamic volume covered by a given number of injections, with 93.4% of the thalamus covered by at least 1 injection (arrow). (f) The fraction of each thalamic nucleus covered by at least one and at least two injections. All scale bars are 1 mm.

