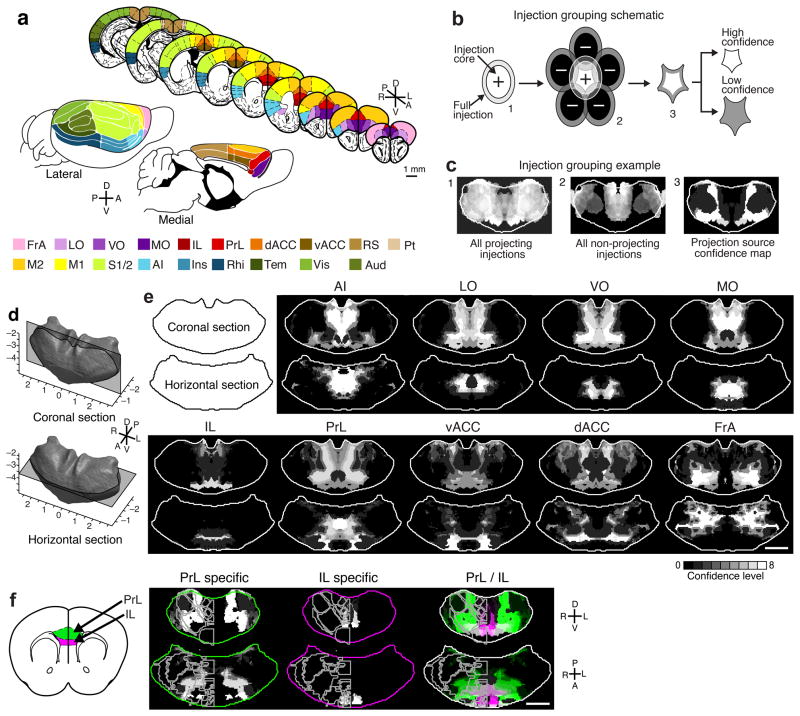
Figure 3.
Localization of the thalamic origins of cortical projections. (a) Illustration showing the 19 cortical areas examined (modified from PMBA25 and reference 47): whole brain views (lower) and coronal sections (upper). (b) Simplified schematic of thalamic localization method: 1. The volume of each injection is eroded to generate an injection core (Fig. 1 and Methods); 2. Injections that send projections to a region of interest (ROI) (positive injections) are summed, and those that do not (negative injections) are subtracted; 3. Resulting in the precise thalamic volume projecting to each ROI, which is separated into eight confidence levels (Supplementary Fig. 8). (c) Example thalamus section illustrating the injection grouping method summarized in panel b. Sections 1 and 2: injections that do project and do not project to a target, respectively. Section 3: the refined thalamic volume projecting to that target (i.e. the confidence map). (d) Diagram of the thalamus sections shown in e. Coronal section −1.16 mm posterior to bregma (top), horizontal section −3.52 mm ventral to bregma (bottom). (e) Confidence maps (gray scale) show the thalamic origin of projections to nine frontal brain areas. See Supplementary Figure 9 for full confidence maps to all cortical areas. (f) Localization of exclusive and shared thalamocortical projections to PrL (green) and IL (magenta) through direct comparison of their confidence maps (right). Nuclear boundaries shown on left half of each thalamus section (PMBA). Coronal section −0.61 mm posterior to bregma (top), horizontal section −4.06 mm ventral to bregma (bottom). All scale bars are 1 mm.

