Figure 4.
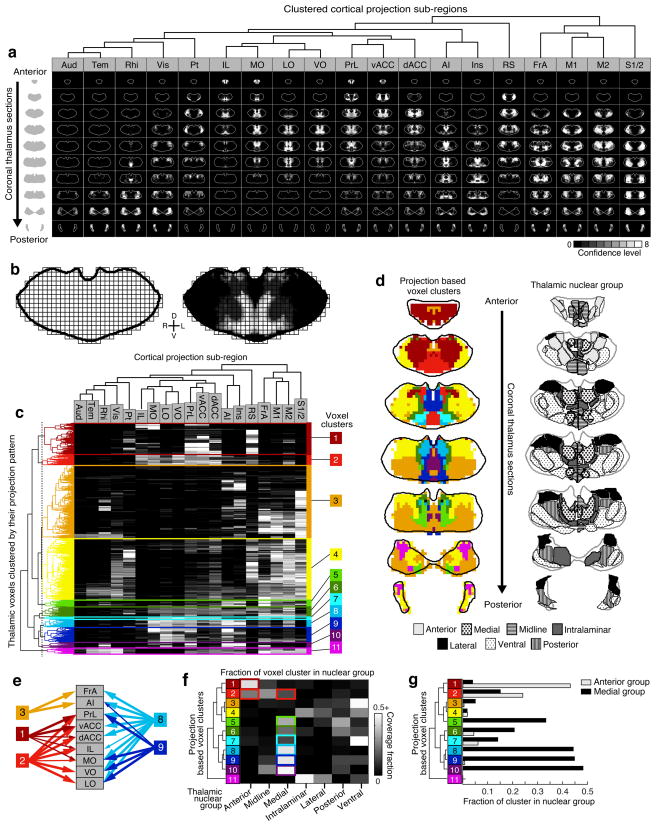
Localizing thalamic subdivisions based on cortical projection patterns. (a) Summary of confidence maps to all cortical sub-regions, clustered based on confidence map similarity (determined in panel c). See Supplementary Fig. 9 for large confidence maps. (b) The thalamus is down-sampled into 150 × 150 × 150 μm voxels (left) and the average confidence level within each voxel is determined for each cortical projection (example, right). (c) All thalamic voxels (rows) are hierarchically clustered based on their cortical projection patterns, and cortical subregions (columns) are clustered based on which thalamic voxels innervate them. The average confidence level is indicated in gray scale, as in a. A threshold (gray dashed line, left) was applied to identify 11 distinct clusters. (d) Coronal thalamus sections showing the spatial location of clusters from c (left), with the corresponding atlas sections (PMBA, left half & ABA, right half) showing thalamic nuclear groups for comparison (right). (e) Schematic showing the convergence and divergence of projections for several clusters. (f) Overlap between voxel clusters (rows) and atlas-defined nuclear groups (columns). Colored boxes highlight the clusters that are dominant in (compose >10% of) the anterior and medial thalamic groups. Some nuclear groups are covered by relatively few clusters that have closely related projection patterns (e.g., the anterior group mainly contains clusters 1 and 2), while other groups contain clusters with disparate projection patterns (e.g., the medial group contains clusters 2 & 5–10). (g) Coverage of the anterior and medial nuclear groups by each voxel cluster.

