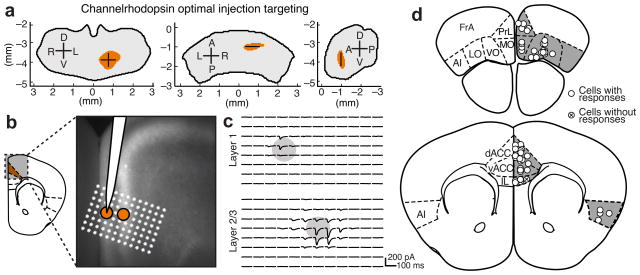
Figure 5.
Targeting anatomically defined thalamocortical projections to verify that they form functional synapses. (a) Optimal injection coordinates for dACC, i.e. the most probable location to inject in order to target thalamic projections to dACC, determined from the confidence maps in Fig. 3. Anterior (left), dorsal (middle), and lateral (right) views of the target thalamic volume. (See Supplementary Fig. 11 for details). Shown in millimeters relative to bregma. (b–c) Optimal injection coordinates were used to target thalamic projections to dACC. (b) Image of thalamic axons expressing fluorescently-tagged channelrhodopsin 2 (ChR2) in dACC. Orange circles indicate the location of two neurons recorded sequentially in layers 1 and 2/3 of dACC during optogenetic activation of the ChR2 expressing thalamic axons. White stars indicate the location of ChR2 stimulation by blue light (8 × 12 grid, 50 μm spacing). (c) Current recordings of the two neurons shown in panel b, showing synaptic currents elicited by light stimulation of thalamic axons. Each current trace corresponds to the white star grid in panel b rotated 30° counter-clockwise. The center of each circle indicates the location of the cell body. (d) The approximate locations of all neurons recorded (white circles) are shown, and crossed circles indicate no postsynaptic response. The approximate position shows the cortical layer (superficial: layer 1, middle: layers 2–4, and deep: layers 5–6), and the anterior-posterior extent of each area is collapsed into a single section (schematic modified from PMBA).

