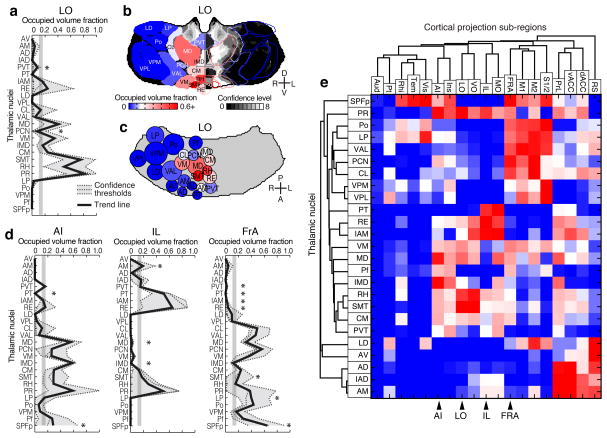
Figure 6.
Nuclear localization of the thalamic origins of frontal projections. (a–c) Three representations of the nucleus origin data for LO (See Supplementary Fig. 12 for remaining cortical sub-regions). (a) The fractions of each thalamic nucleus projecting to LO are shown in three confidence levels (dashed lines) with their average (black line). Vertical gray line: the inflection point in the color scale used in panels b, c, and e. Asterisks indicate potential differences between localized thalamocortical projection origins and literature data in rat (see Supplementary Fig. 13a for details). (b) Single coronal section through the confidence map for LO (gray scale) overlaid with nuclear subdivisions from the ABA. The atlas is colored on the left to indicate the fraction of each nucleus covered by the average confidence trace (black line in panel a), with the inflection point (white) at 15%. (c) Spatial representation of all nuclei projecting to the LO. Circle diameters correspond to the relative size of each nucleus and their positions correspond to their relative center-of-mass location within the thalamus in the anterior-posterior and medial-lateral axes. Color scale is the same as in panel b. (d) The fractions of each thalamic nucleus projecting to AI, IL, and FrA, shown in three confidence levels (dashed lines) with their average (black line), as described in panel a. (e) Aggregate nucleus coverage map for all cortical areas. Nuclei (rows) and cortical sub-regions (columns) are hierarchically clustered based on output and input similarity, respectively. Color scale is the same as panel b.

